Liberian vs Immigrants from Kenya Single Mother Poverty
COMPARE
Liberian
Immigrants from Kenya
Single Mother Poverty
Single Mother Poverty Comparison
Liberians
Immigrants from Kenya
29.9%
SINGLE MOTHER POVERTY
11.7/ 100
METRIC RATING
214th/ 347
METRIC RANK
28.9%
SINGLE MOTHER POVERTY
65.9/ 100
METRIC RATING
164th/ 347
METRIC RANK
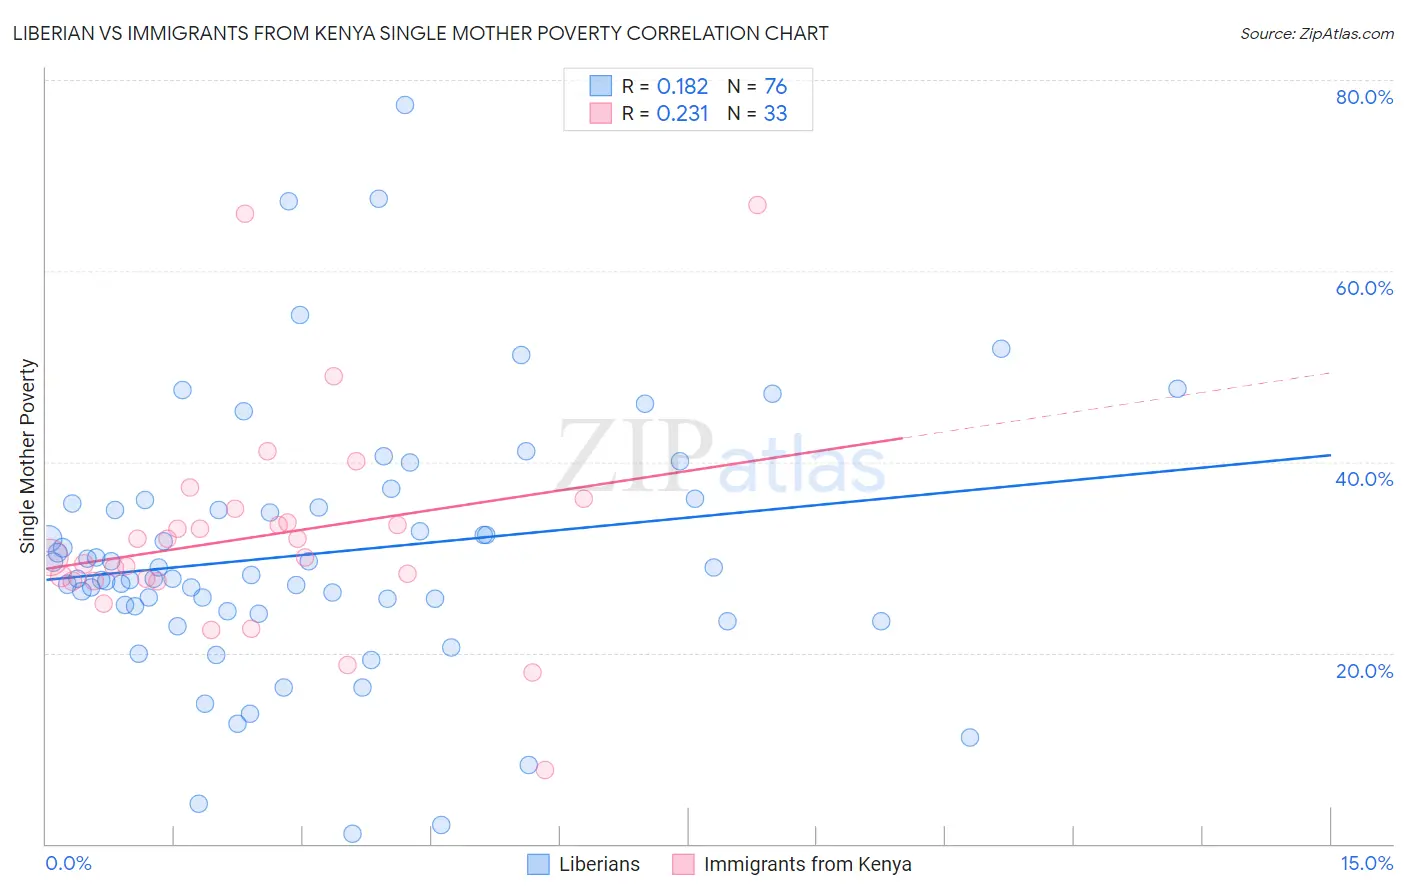
Liberian vs Immigrants from Kenya Single Mother Poverty Correlation Chart
The statistical analysis conducted on geographies consisting of 117,524,642 people shows a poor positive correlation between the proportion of Liberians and poverty level among single mothers in the United States with a correlation coefficient (R) of 0.182 and weighted average of 29.9%. Similarly, the statistical analysis conducted on geographies consisting of 215,478,455 people shows a weak positive correlation between the proportion of Immigrants from Kenya and poverty level among single mothers in the United States with a correlation coefficient (R) of 0.231 and weighted average of 28.9%, a difference of 3.2%.
Single Mother Poverty Correlation Summary
| Measurement | Liberian | Immigrants from Kenya |
| Minimum | 1.1% | 7.7% |
| Maximum | 77.3% | 66.9% |
| Range | 76.3% | 59.2% |
| Mean | 30.4% | 32.2% |
| Median | 28.0% | 30.0% |
| Interquartile 25% (IQ1) | 24.7% | 27.6% |
| Interquartile 75% (IQ3) | 35.5% | 34.3% |
| Interquartile Range (IQR) | 10.8% | 6.8% |
| Standard Deviation (Sample) | 13.6% | 11.5% |
| Standard Deviation (Population) | 13.5% | 11.3% |
Similar Demographics by Single Mother Poverty
Demographics Similar to Liberians by Single Mother Poverty
In terms of single mother poverty, the demographic groups most similar to Liberians are Jamaican (29.9%, a difference of 0.0%), Immigrants from Western Africa (29.9%, a difference of 0.020%), Immigrants from Thailand (29.9%, a difference of 0.030%), Immigrants from Ghana (29.9%, a difference of 0.050%), and Nicaraguan (29.8%, a difference of 0.080%).
| Demographics | Rating | Rank | Single Mother Poverty |
| Immigrants | Panama | 15.5 /100 | #207 | Poor 29.8% |
| Immigrants | Guyana | 14.7 /100 | #208 | Poor 29.8% |
| Irish | 13.9 /100 | #209 | Poor 29.8% |
| Haitians | 13.3 /100 | #210 | Poor 29.8% |
| Guyanese | 12.8 /100 | #211 | Poor 29.8% |
| Nicaraguans | 12.4 /100 | #212 | Poor 29.8% |
| Immigrants | Thailand | 12.0 /100 | #213 | Poor 29.9% |
| Liberians | 11.7 /100 | #214 | Poor 29.9% |
| Jamaicans | 11.7 /100 | #215 | Poor 29.9% |
| Immigrants | Western Africa | 11.5 /100 | #216 | Poor 29.9% |
| Immigrants | Ghana | 11.3 /100 | #217 | Poor 29.9% |
| Hungarians | 10.3 /100 | #218 | Poor 29.9% |
| Finns | 9.3 /100 | #219 | Tragic 30.0% |
| Germans | 8.8 /100 | #220 | Tragic 30.0% |
| Immigrants | Eritrea | 7.7 /100 | #221 | Tragic 30.0% |
Demographics Similar to Immigrants from Kenya by Single Mother Poverty
In terms of single mother poverty, the demographic groups most similar to Immigrants from Kenya are Immigrants from Nigeria (28.9%, a difference of 0.0%), Scandinavian (28.9%, a difference of 0.020%), Immigrants from Cambodia (28.9%, a difference of 0.040%), Japanese (28.9%, a difference of 0.11%), and Czech (28.9%, a difference of 0.14%).
| Demographics | Rating | Rank | Single Mother Poverty |
| Immigrants | Western Europe | 71.1 /100 | #157 | Good 28.9% |
| Immigrants | Hungary | 70.6 /100 | #158 | Good 28.9% |
| Czechs | 68.4 /100 | #159 | Good 28.9% |
| Japanese | 68.0 /100 | #160 | Good 28.9% |
| Immigrants | Cambodia | 66.6 /100 | #161 | Good 28.9% |
| Scandinavians | 66.2 /100 | #162 | Good 28.9% |
| Immigrants | Nigeria | 65.9 /100 | #163 | Good 28.9% |
| Immigrants | Kenya | 65.9 /100 | #164 | Good 28.9% |
| Arabs | 60.7 /100 | #165 | Good 29.0% |
| Inupiat | 60.4 /100 | #166 | Good 29.0% |
| Costa Ricans | 58.4 /100 | #167 | Average 29.0% |
| Europeans | 57.6 /100 | #168 | Average 29.1% |
| Immigrants | Uruguay | 57.2 /100 | #169 | Average 29.1% |
| New Zealanders | 55.1 /100 | #170 | Average 29.1% |
| Puget Sound Salish | 55.1 /100 | #171 | Average 29.1% |