Liberian vs Immigrants from Caribbean Bachelor's Degree
COMPARE
Liberian
Immigrants from Caribbean
Bachelor's Degree
Bachelor's Degree Comparison
Liberians
Immigrants from Caribbean
34.6%
BACHELOR'S DEGREE
2.8/ 100
METRIC RATING
236th/ 347
METRIC RANK
31.4%
BACHELOR'S DEGREE
0.1/ 100
METRIC RATING
282nd/ 347
METRIC RANK
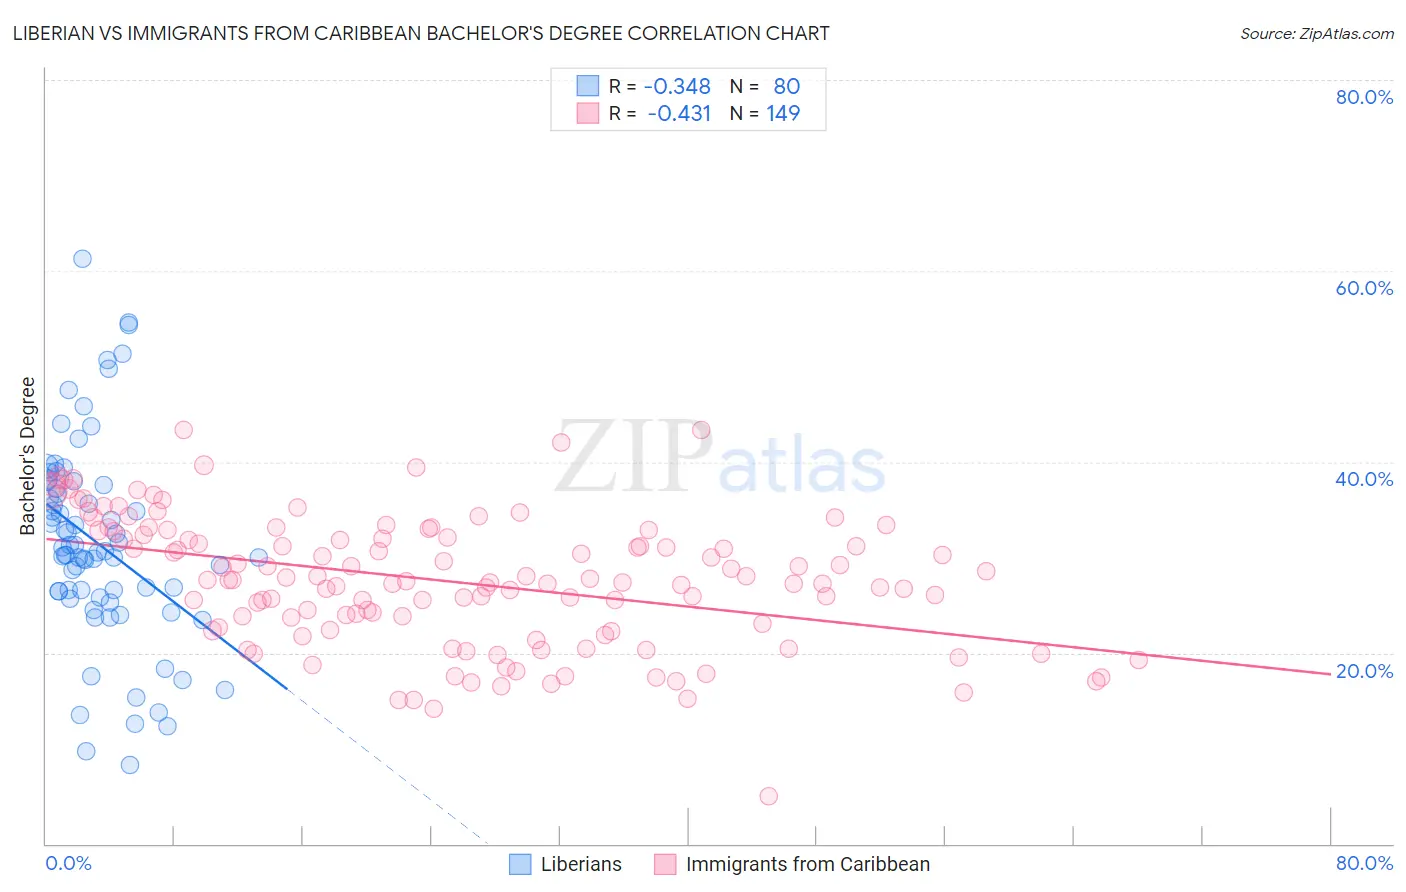
Liberian vs Immigrants from Caribbean Bachelor's Degree Correlation Chart
The statistical analysis conducted on geographies consisting of 118,099,075 people shows a mild negative correlation between the proportion of Liberians and percentage of population with at least bachelor's degree education in the United States with a correlation coefficient (R) of -0.348 and weighted average of 34.6%. Similarly, the statistical analysis conducted on geographies consisting of 450,021,690 people shows a moderate negative correlation between the proportion of Immigrants from Caribbean and percentage of population with at least bachelor's degree education in the United States with a correlation coefficient (R) of -0.431 and weighted average of 31.4%, a difference of 10.0%.
Bachelor's Degree Correlation Summary
| Measurement | Liberian | Immigrants from Caribbean |
| Minimum | 8.2% | 4.9% |
| Maximum | 61.3% | 43.4% |
| Range | 53.0% | 38.5% |
| Mean | 31.5% | 27.5% |
| Median | 30.6% | 27.6% |
| Interquartile 25% (IQ1) | 26.1% | 22.5% |
| Interquartile 75% (IQ3) | 37.3% | 32.6% |
| Interquartile Range (IQR) | 11.2% | 10.1% |
| Standard Deviation (Sample) | 10.5% | 6.8% |
| Standard Deviation (Population) | 10.4% | 6.8% |
Similar Demographics by Bachelor's Degree
Demographics Similar to Liberians by Bachelor's Degree
In terms of bachelor's degree, the demographic groups most similar to Liberians are Tlingit-Haida (34.6%, a difference of 0.040%), Immigrants from West Indies (34.6%, a difference of 0.11%), Guamanian/Chamorro (34.6%, a difference of 0.20%), Guyanese (34.5%, a difference of 0.32%), and British West Indian (34.5%, a difference of 0.34%).
| Demographics | Rating | Rank | Bachelor's Degree |
| Whites/Caucasians | 5.9 /100 | #229 | Tragic 35.3% |
| Immigrants | Grenada | 4.3 /100 | #230 | Tragic 35.0% |
| Immigrants | St. Vincent and the Grenadines | 4.3 /100 | #231 | Tragic 35.0% |
| Hmong | 3.4 /100 | #232 | Tragic 34.8% |
| Immigrants | Ecuador | 3.3 /100 | #233 | Tragic 34.7% |
| Guamanians/Chamorros | 3.0 /100 | #234 | Tragic 34.6% |
| Immigrants | West Indies | 2.9 /100 | #235 | Tragic 34.6% |
| Liberians | 2.8 /100 | #236 | Tragic 34.6% |
| Tlingit-Haida | 2.8 /100 | #237 | Tragic 34.6% |
| Guyanese | 2.5 /100 | #238 | Tragic 34.5% |
| British West Indians | 2.5 /100 | #239 | Tragic 34.5% |
| Tongans | 2.0 /100 | #240 | Tragic 34.3% |
| Immigrants | Cambodia | 1.9 /100 | #241 | Tragic 34.2% |
| Immigrants | Nonimmigrants | 1.8 /100 | #242 | Tragic 34.2% |
| Immigrants | Guyana | 1.4 /100 | #243 | Tragic 33.9% |
Demographics Similar to Immigrants from Caribbean by Bachelor's Degree
In terms of bachelor's degree, the demographic groups most similar to Immigrants from Caribbean are Blackfeet (31.5%, a difference of 0.15%), Honduran (31.3%, a difference of 0.28%), Haitian (31.3%, a difference of 0.31%), Aleut (31.3%, a difference of 0.32%), and Immigrants from El Salvador (31.3%, a difference of 0.38%).
| Demographics | Rating | Rank | Bachelor's Degree |
| Samoans | 0.1 /100 | #275 | Tragic 31.8% |
| Salvadorans | 0.1 /100 | #276 | Tragic 31.8% |
| Dominicans | 0.1 /100 | #277 | Tragic 31.8% |
| Marshallese | 0.1 /100 | #278 | Tragic 31.7% |
| Hawaiians | 0.1 /100 | #279 | Tragic 31.6% |
| Immigrants | Laos | 0.1 /100 | #280 | Tragic 31.6% |
| Blackfeet | 0.1 /100 | #281 | Tragic 31.5% |
| Immigrants | Caribbean | 0.1 /100 | #282 | Tragic 31.4% |
| Hondurans | 0.1 /100 | #283 | Tragic 31.3% |
| Haitians | 0.1 /100 | #284 | Tragic 31.3% |
| Aleuts | 0.1 /100 | #285 | Tragic 31.3% |
| Immigrants | El Salvador | 0.1 /100 | #286 | Tragic 31.3% |
| Ottawa | 0.1 /100 | #287 | Tragic 31.1% |
| Guatemalans | 0.1 /100 | #288 | Tragic 31.0% |
| Puerto Ricans | 0.1 /100 | #289 | Tragic 31.0% |