Sioux vs Carpatho Rusyn Single Female Poverty
COMPARE
Sioux
Carpatho Rusyn
Single Female Poverty
Single Female Poverty Comparison
Sioux
Carpatho Rusyns
31.3%
SINGLE FEMALE POVERTY
0.0/ 100
METRIC RATING
341st/ 347
METRIC RANK
20.0%
SINGLE FEMALE POVERTY
96.1/ 100
METRIC RATING
111th/ 347
METRIC RANK
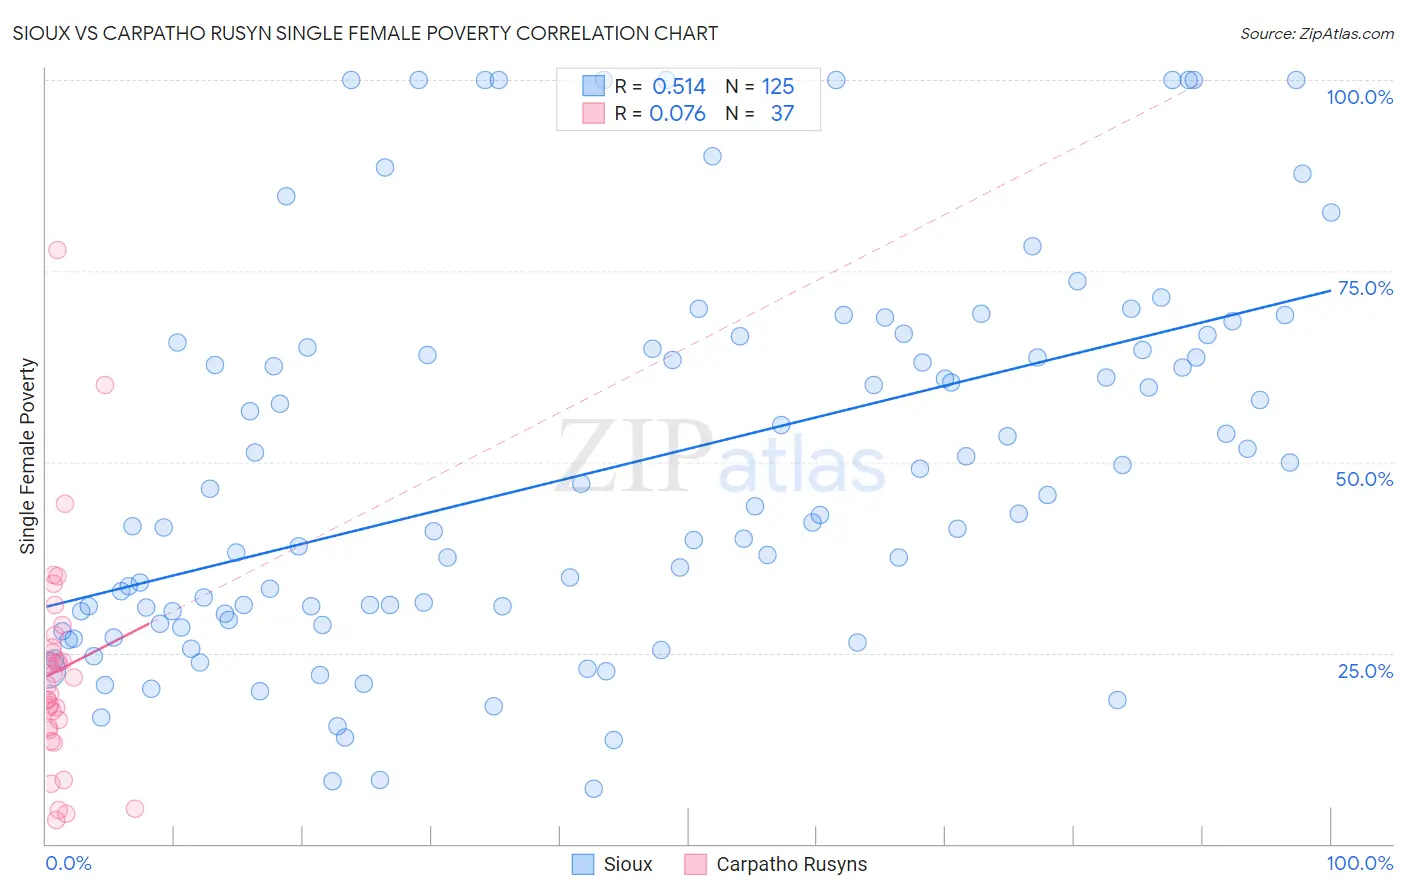
Sioux vs Carpatho Rusyn Single Female Poverty Correlation Chart
The statistical analysis conducted on geographies consisting of 232,047,098 people shows a substantial positive correlation between the proportion of Sioux and poverty level among single females in the United States with a correlation coefficient (R) of 0.514 and weighted average of 31.3%. Similarly, the statistical analysis conducted on geographies consisting of 58,553,439 people shows a slight positive correlation between the proportion of Carpatho Rusyns and poverty level among single females in the United States with a correlation coefficient (R) of 0.076 and weighted average of 20.0%, a difference of 56.6%.
Single Female Poverty Correlation Summary
| Measurement | Sioux | Carpatho Rusyn |
| Minimum | 7.1% | 3.1% |
| Maximum | 100.0% | 77.8% |
| Range | 92.9% | 74.7% |
| Mean | 49.1% | 22.7% |
| Median | 43.3% | 20.7% |
| Interquartile 25% (IQ1) | 29.7% | 15.1% |
| Interquartile 75% (IQ3) | 64.9% | 26.5% |
| Interquartile Range (IQR) | 35.2% | 11.4% |
| Standard Deviation (Sample) | 24.8% | 14.7% |
| Standard Deviation (Population) | 24.7% | 14.5% |
Similar Demographics by Single Female Poverty
Demographics Similar to Sioux by Single Female Poverty
In terms of single female poverty, the demographic groups most similar to Sioux are Navajo (31.7%, a difference of 1.3%), Cajun (30.6%, a difference of 2.0%), Cheyenne (30.4%, a difference of 2.8%), Pima (30.3%, a difference of 3.0%), and Crow (32.4%, a difference of 3.7%).
| Demographics | Rating | Rank | Single Female Poverty |
| Ute | 0.0 /100 | #333 | Tragic 28.4% |
| Pueblo | 0.0 /100 | #334 | Tragic 28.6% |
| Immigrants | Yemen | 0.0 /100 | #335 | Tragic 28.9% |
| Colville | 0.0 /100 | #336 | Tragic 29.1% |
| Yuman | 0.0 /100 | #337 | Tragic 29.4% |
| Pima | 0.0 /100 | #338 | Tragic 30.3% |
| Cheyenne | 0.0 /100 | #339 | Tragic 30.4% |
| Cajuns | 0.0 /100 | #340 | Tragic 30.6% |
| Sioux | 0.0 /100 | #341 | Tragic 31.3% |
| Navajo | 0.0 /100 | #342 | Tragic 31.7% |
| Crow | 0.0 /100 | #343 | Tragic 32.4% |
| Lumbee | 0.0 /100 | #344 | Tragic 33.0% |
| Houma | 0.0 /100 | #345 | Tragic 33.8% |
| Puerto Ricans | 0.0 /100 | #346 | Tragic 34.1% |
| Tohono O'odham | 0.0 /100 | #347 | Tragic 34.2% |
Demographics Similar to Carpatho Rusyns by Single Female Poverty
In terms of single female poverty, the demographic groups most similar to Carpatho Rusyns are Immigrants from Netherlands (20.0%, a difference of 0.060%), Immigrants from Zimbabwe (20.0%, a difference of 0.12%), Immigrants from Colombia (20.0%, a difference of 0.12%), Immigrants from Northern Africa (20.0%, a difference of 0.14%), and Immigrants from Kazakhstan (20.0%, a difference of 0.17%).
| Demographics | Rating | Rank | Single Female Poverty |
| Chileans | 96.9 /100 | #104 | Exceptional 19.9% |
| Israelis | 96.9 /100 | #105 | Exceptional 19.9% |
| Ethiopians | 96.7 /100 | #106 | Exceptional 19.9% |
| Immigrants | Syria | 96.7 /100 | #107 | Exceptional 19.9% |
| Native Hawaiians | 96.6 /100 | #108 | Exceptional 19.9% |
| Colombians | 96.6 /100 | #109 | Exceptional 19.9% |
| Immigrants | Western Asia | 96.5 /100 | #110 | Exceptional 19.9% |
| Carpatho Rusyns | 96.1 /100 | #111 | Exceptional 20.0% |
| Immigrants | Netherlands | 96.0 /100 | #112 | Exceptional 20.0% |
| Immigrants | Zimbabwe | 95.9 /100 | #113 | Exceptional 20.0% |
| Immigrants | Colombia | 95.9 /100 | #114 | Exceptional 20.0% |
| Immigrants | Northern Africa | 95.8 /100 | #115 | Exceptional 20.0% |
| Immigrants | Kazakhstan | 95.7 /100 | #116 | Exceptional 20.0% |
| Poles | 95.6 /100 | #117 | Exceptional 20.0% |
| Immigrants | Afghanistan | 95.4 /100 | #118 | Exceptional 20.0% |