Korean vs Immigrants from Sweden Family Poverty
COMPARE
Korean
Immigrants from Sweden
Family Poverty
Family Poverty Comparison
Koreans
Immigrants from Sweden
7.8%
FAMILY POVERTY
98.3/ 100
METRIC RATING
64th/ 347
METRIC RANK
7.7%
FAMILY POVERTY
98.8/ 100
METRIC RATING
54th/ 347
METRIC RANK
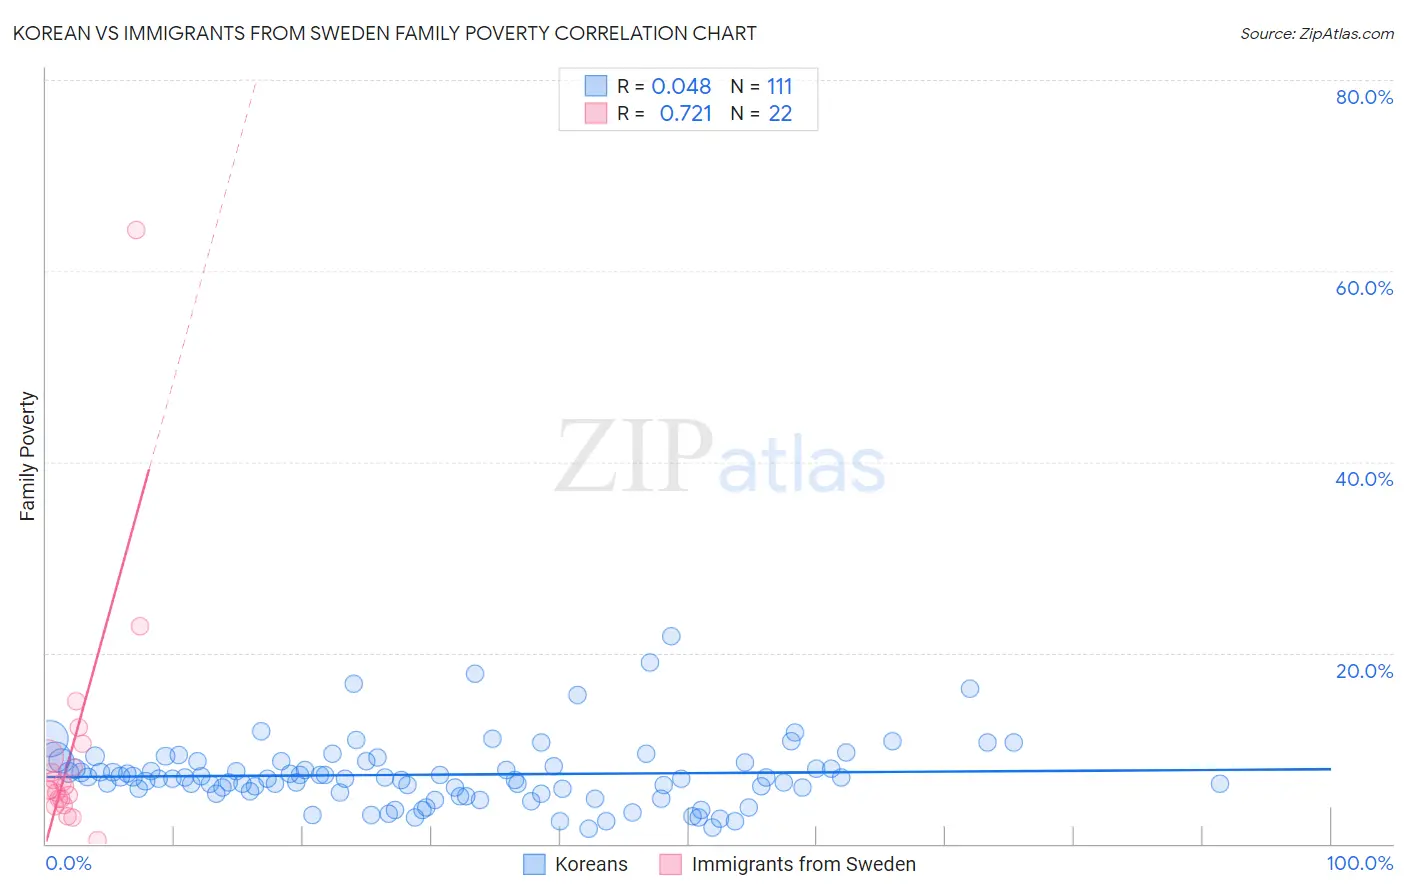
Korean vs Immigrants from Sweden Family Poverty Correlation Chart
The statistical analysis conducted on geographies consisting of 508,576,179 people shows no correlation between the proportion of Koreans and poverty level among families in the United States with a correlation coefficient (R) of 0.048 and weighted average of 7.8%. Similarly, the statistical analysis conducted on geographies consisting of 164,497,176 people shows a strong positive correlation between the proportion of Immigrants from Sweden and poverty level among families in the United States with a correlation coefficient (R) of 0.721 and weighted average of 7.7%, a difference of 1.2%.
Family Poverty Correlation Summary
| Measurement | Korean | Immigrants from Sweden |
| Minimum | 1.6% | 0.43% |
| Maximum | 21.8% | 64.3% |
| Range | 20.2% | 63.9% |
| Mean | 7.2% | 9.7% |
| Median | 6.9% | 5.8% |
| Interquartile 25% (IQ1) | 5.4% | 4.8% |
| Interquartile 75% (IQ3) | 8.6% | 9.1% |
| Interquartile Range (IQR) | 3.2% | 4.4% |
| Standard Deviation (Sample) | 3.5% | 13.1% |
| Standard Deviation (Population) | 3.5% | 12.8% |
Demographics Similar to Koreans and Immigrants from Sweden by Family Poverty
In terms of family poverty, the demographic groups most similar to Koreans are Immigrants from Bulgaria (7.8%, a difference of 0.010%), Dutch (7.8%, a difference of 0.070%), Northern European (7.8%, a difference of 0.080%), Australian (7.8%, a difference of 0.12%), and Immigrants from Belgium (7.8%, a difference of 0.13%). Similarly, the demographic groups most similar to Immigrants from Sweden are Swiss (7.7%, a difference of 0.010%), Immigrants from Eastern Asia (7.7%, a difference of 0.030%), Indian (Asian) (7.7%, a difference of 0.070%), Immigrants from Serbia (7.7%, a difference of 0.070%), and Asian (7.7%, a difference of 0.16%).
| Demographics | Rating | Rank | Family Poverty |
| Immigrants | Bolivia | 98.9 /100 | #49 | Exceptional 7.7% |
| Immigrants | North Macedonia | 98.9 /100 | #50 | Exceptional 7.7% |
| Immigrants | Moldova | 98.8 /100 | #51 | Exceptional 7.7% |
| Indians (Asian) | 98.8 /100 | #52 | Exceptional 7.7% |
| Swiss | 98.8 /100 | #53 | Exceptional 7.7% |
| Immigrants | Sweden | 98.8 /100 | #54 | Exceptional 7.7% |
| Immigrants | Eastern Asia | 98.7 /100 | #55 | Exceptional 7.7% |
| Immigrants | Serbia | 98.7 /100 | #56 | Exceptional 7.7% |
| Asians | 98.7 /100 | #57 | Exceptional 7.7% |
| Finns | 98.7 /100 | #58 | Exceptional 7.7% |
| Europeans | 98.7 /100 | #59 | Exceptional 7.7% |
| Immigrants | Greece | 98.7 /100 | #60 | Exceptional 7.7% |
| Immigrants | Netherlands | 98.6 /100 | #61 | Exceptional 7.7% |
| Macedonians | 98.6 /100 | #62 | Exceptional 7.8% |
| Zimbabweans | 98.4 /100 | #63 | Exceptional 7.8% |
| Koreans | 98.3 /100 | #64 | Exceptional 7.8% |
| Immigrants | Bulgaria | 98.3 /100 | #65 | Exceptional 7.8% |
| Dutch | 98.3 /100 | #66 | Exceptional 7.8% |
| Northern Europeans | 98.3 /100 | #67 | Exceptional 7.8% |
| Australians | 98.2 /100 | #68 | Exceptional 7.8% |
| Immigrants | Belgium | 98.2 /100 | #69 | Exceptional 7.8% |