Korean vs Hungarian Per Capita Income
COMPARE
Korean
Hungarian
Per Capita Income
Per Capita Income Comparison
Koreans
Hungarians
$44,522
PER CAPITA INCOME
72.5/ 100
METRIC RATING
149th/ 347
METRIC RANK
$45,426
PER CAPITA INCOME
87.9/ 100
METRIC RATING
135th/ 347
METRIC RANK
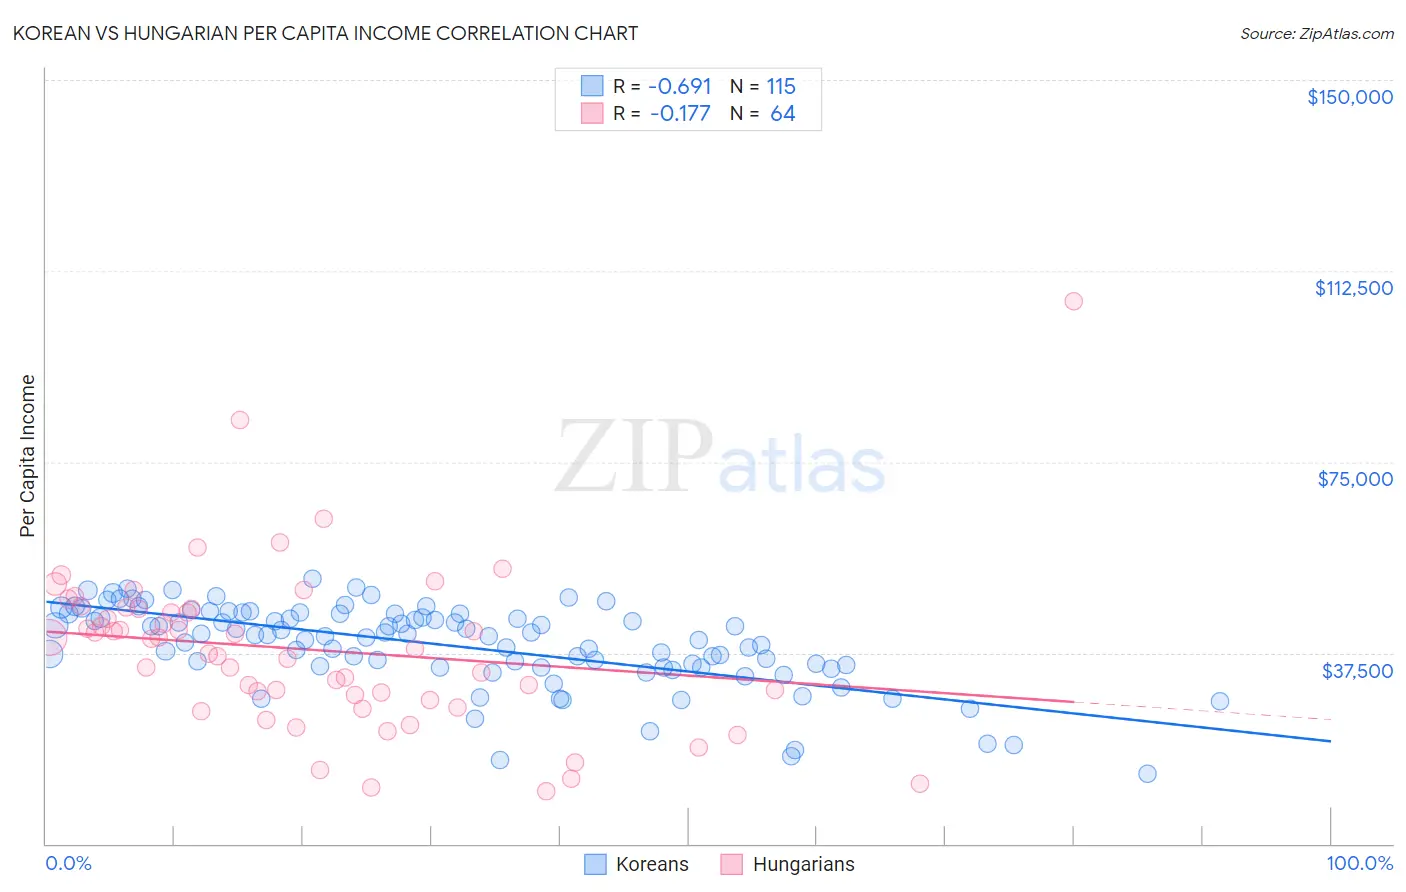
Korean vs Hungarian Per Capita Income Correlation Chart
The statistical analysis conducted on geographies consisting of 510,996,517 people shows a significant negative correlation between the proportion of Koreans and per capita income in the United States with a correlation coefficient (R) of -0.691 and weighted average of $44,522. Similarly, the statistical analysis conducted on geographies consisting of 486,270,132 people shows a poor negative correlation between the proportion of Hungarians and per capita income in the United States with a correlation coefficient (R) of -0.177 and weighted average of $45,426, a difference of 2.0%.
Per Capita Income Correlation Summary
| Measurement | Korean | Hungarian |
| Minimum | $13,802 | $10,415 |
| Maximum | $52,147 | $106,430 |
| Range | $38,345 | $96,015 |
| Mean | $38,981 | $38,150 |
| Median | $40,908 | $39,313 |
| Interquartile 25% (IQ1) | $34,687 | $28,777 |
| Interquartile 75% (IQ3) | $45,181 | $46,125 |
| Interquartile Range (IQR) | $10,494 | $17,348 |
| Standard Deviation (Sample) | $8,123 | $16,236 |
| Standard Deviation (Population) | $8,088 | $16,109 |
Demographics Similar to Koreans and Hungarians by Per Capita Income
In terms of per capita income, the demographic groups most similar to Koreans are Immigrants from Eritrea ($44,509, a difference of 0.030%), Immigrants from Armenia ($44,552, a difference of 0.070%), Norwegian ($44,480, a difference of 0.10%), Peruvian ($44,479, a difference of 0.10%), and Czech ($44,595, a difference of 0.16%). Similarly, the demographic groups most similar to Hungarians are Slovene ($45,581, a difference of 0.34%), Pakistani ($45,587, a difference of 0.35%), Jordanian ($45,605, a difference of 0.39%), Immigrants from Oceania ($45,220, a difference of 0.46%), and Immigrants from Syria ($45,218, a difference of 0.46%).
| Demographics | Rating | Rank | Per Capita Income |
| Jordanians | 89.9 /100 | #132 | Excellent $45,605 |
| Pakistanis | 89.7 /100 | #133 | Excellent $45,587 |
| Slovenes | 89.6 /100 | #134 | Excellent $45,581 |
| Hungarians | 87.9 /100 | #135 | Excellent $45,426 |
| Immigrants | Oceania | 85.2 /100 | #136 | Excellent $45,220 |
| Immigrants | Syria | 85.2 /100 | #137 | Excellent $45,218 |
| Assyrians/Chaldeans/Syriacs | 84.8 /100 | #138 | Excellent $45,195 |
| Basques | 83.2 /100 | #139 | Excellent $45,086 |
| Immigrants | Jordan | 82.9 /100 | #140 | Excellent $45,066 |
| Slavs | 82.6 /100 | #141 | Excellent $45,049 |
| Ugandans | 82.6 /100 | #142 | Excellent $45,047 |
| Immigrants | Uganda | 82.5 /100 | #143 | Excellent $45,043 |
| Icelanders | 81.6 /100 | #144 | Excellent $44,987 |
| Immigrants | Afghanistan | 78.0 /100 | #145 | Good $44,790 |
| Irish | 75.8 /100 | #146 | Good $44,679 |
| Czechs | 74.1 /100 | #147 | Good $44,595 |
| Immigrants | Armenia | 73.1 /100 | #148 | Good $44,552 |
| Koreans | 72.5 /100 | #149 | Good $44,522 |
| Immigrants | Eritrea | 72.1 /100 | #150 | Good $44,509 |
| Norwegians | 71.5 /100 | #151 | Good $44,480 |
| Peruvians | 71.5 /100 | #152 | Good $44,479 |