Korean vs Cuban High School Diploma
COMPARE
Korean
Cuban
High School Diploma
High School Diploma Comparison
Koreans
Cubans
88.6%
HIGH SCHOOL DIPLOMA
18.1/ 100
METRIC RATING
201st/ 347
METRIC RANK
85.4%
HIGH SCHOOL DIPLOMA
0.0/ 100
METRIC RATING
303rd/ 347
METRIC RANK
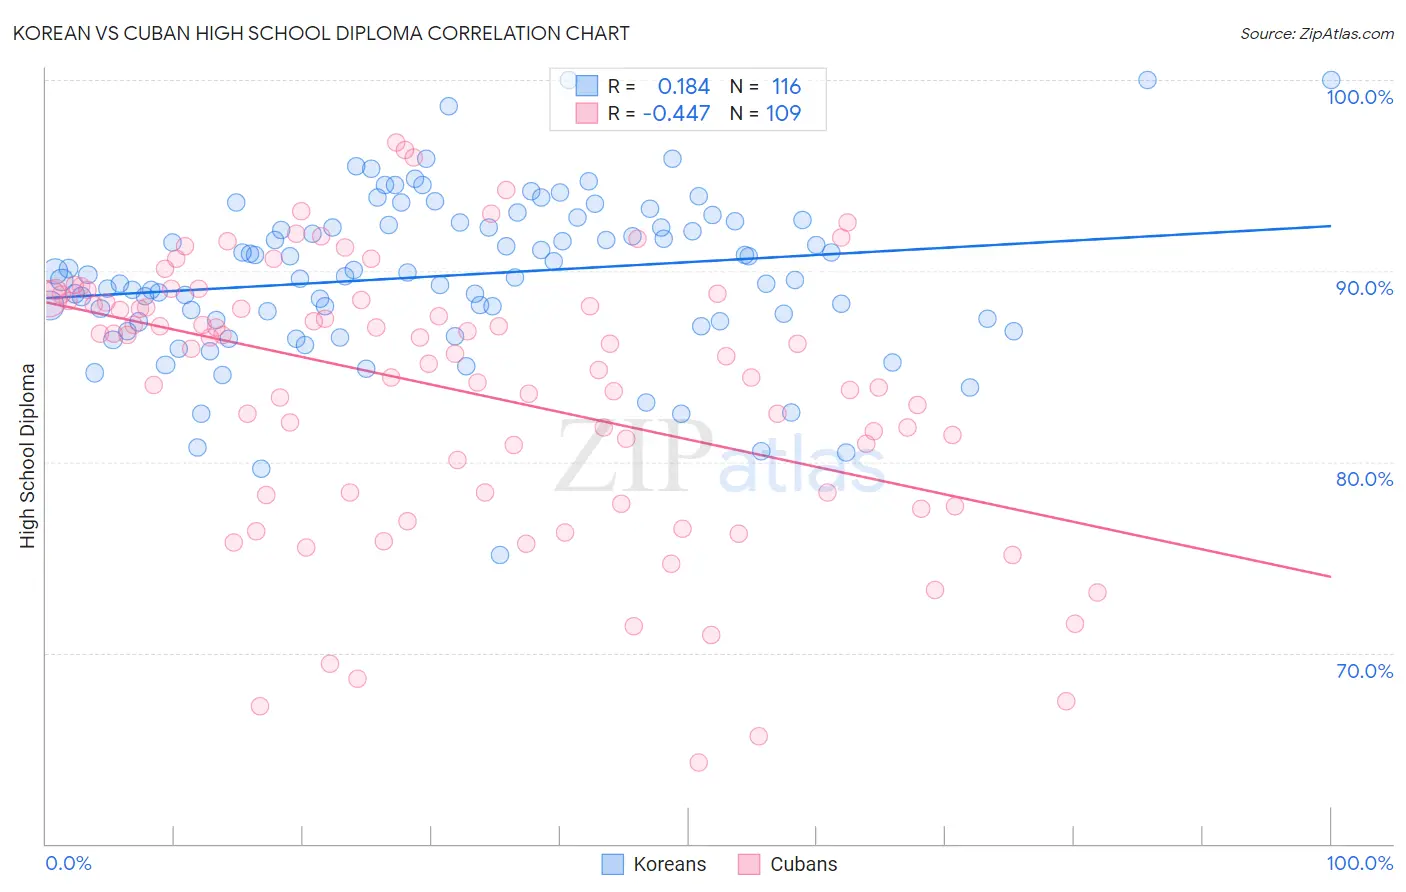
Korean vs Cuban High School Diploma Correlation Chart
The statistical analysis conducted on geographies consisting of 510,944,198 people shows a poor positive correlation between the proportion of Koreans and percentage of population with at least high school diploma education in the United States with a correlation coefficient (R) of 0.184 and weighted average of 88.6%. Similarly, the statistical analysis conducted on geographies consisting of 449,373,028 people shows a moderate negative correlation between the proportion of Cubans and percentage of population with at least high school diploma education in the United States with a correlation coefficient (R) of -0.447 and weighted average of 85.4%, a difference of 3.8%.
High School Diploma Correlation Summary
| Measurement | Korean | Cuban |
| Minimum | 75.1% | 64.2% |
| Maximum | 100.0% | 96.7% |
| Range | 24.9% | 32.5% |
| Mean | 89.8% | 83.8% |
| Median | 89.8% | 85.9% |
| Interquartile 25% (IQ1) | 87.4% | 78.4% |
| Interquartile 75% (IQ3) | 92.5% | 88.5% |
| Interquartile Range (IQR) | 5.1% | 10.1% |
| Standard Deviation (Sample) | 4.2% | 7.1% |
| Standard Deviation (Population) | 4.2% | 7.0% |
Similar Demographics by High School Diploma
Demographics Similar to Koreans by High School Diploma
In terms of high school diploma, the demographic groups most similar to Koreans are Hawaiian (88.6%, a difference of 0.0%), Panamanian (88.6%, a difference of 0.0%), Marshallese (88.6%, a difference of 0.010%), Liberian (88.7%, a difference of 0.020%), and Somali (88.6%, a difference of 0.020%).
| Demographics | Rating | Rank | High School Diploma |
| Immigrants | Venezuela | 25.8 /100 | #194 | Fair 88.8% |
| Afghans | 23.9 /100 | #195 | Fair 88.8% |
| Immigrants | Southern Europe | 23.4 /100 | #196 | Fair 88.7% |
| French American Indians | 21.5 /100 | #197 | Fair 88.7% |
| Liberians | 18.8 /100 | #198 | Poor 88.7% |
| Marshallese | 18.7 /100 | #199 | Poor 88.6% |
| Hawaiians | 18.3 /100 | #200 | Poor 88.6% |
| Koreans | 18.1 /100 | #201 | Poor 88.6% |
| Panamanians | 18.0 /100 | #202 | Poor 88.6% |
| Somalis | 17.5 /100 | #203 | Poor 88.6% |
| Armenians | 17.2 /100 | #204 | Poor 88.6% |
| Immigrants | Micronesia | 16.4 /100 | #205 | Poor 88.6% |
| Arapaho | 16.1 /100 | #206 | Poor 88.6% |
| Immigrants | Sierra Leone | 15.8 /100 | #207 | Poor 88.6% |
| Portuguese | 14.4 /100 | #208 | Poor 88.5% |
Demographics Similar to Cubans by High School Diploma
In terms of high school diploma, the demographic groups most similar to Cubans are Immigrants from Haiti (85.4%, a difference of 0.0%), Vietnamese (85.4%, a difference of 0.040%), Immigrants from Bangladesh (85.5%, a difference of 0.060%), Guyanese (85.5%, a difference of 0.080%), and Nepalese (85.3%, a difference of 0.11%).
| Demographics | Rating | Rank | High School Diploma |
| Immigrants | Cambodia | 0.0 /100 | #296 | Tragic 85.6% |
| Immigrants | Grenada | 0.0 /100 | #297 | Tragic 85.6% |
| Natives/Alaskans | 0.0 /100 | #298 | Tragic 85.6% |
| Guyanese | 0.0 /100 | #299 | Tragic 85.5% |
| Immigrants | Bangladesh | 0.0 /100 | #300 | Tragic 85.5% |
| Vietnamese | 0.0 /100 | #301 | Tragic 85.4% |
| Immigrants | Haiti | 0.0 /100 | #302 | Tragic 85.4% |
| Cubans | 0.0 /100 | #303 | Tragic 85.4% |
| Nepalese | 0.0 /100 | #304 | Tragic 85.3% |
| Immigrants | Portugal | 0.0 /100 | #305 | Tragic 85.3% |
| Immigrants | Guyana | 0.0 /100 | #306 | Tragic 85.3% |
| Navajo | 0.0 /100 | #307 | Tragic 85.2% |
| Immigrants | Armenia | 0.0 /100 | #308 | Tragic 85.2% |
| Immigrants | Dominica | 0.0 /100 | #309 | Tragic 85.2% |
| Apache | 0.0 /100 | #310 | Tragic 85.1% |