Immigrants from West Indies vs Cuban Single Male Poverty
COMPARE
Immigrants from West Indies
Cuban
Single Male Poverty
Single Male Poverty Comparison
Immigrants from West Indies
Cubans
12.9%
SINGLE MALE POVERTY
33.0/ 100
METRIC RATING
183rd/ 347
METRIC RANK
12.6%
SINGLE MALE POVERTY
79.9/ 100
METRIC RATING
139th/ 347
METRIC RANK
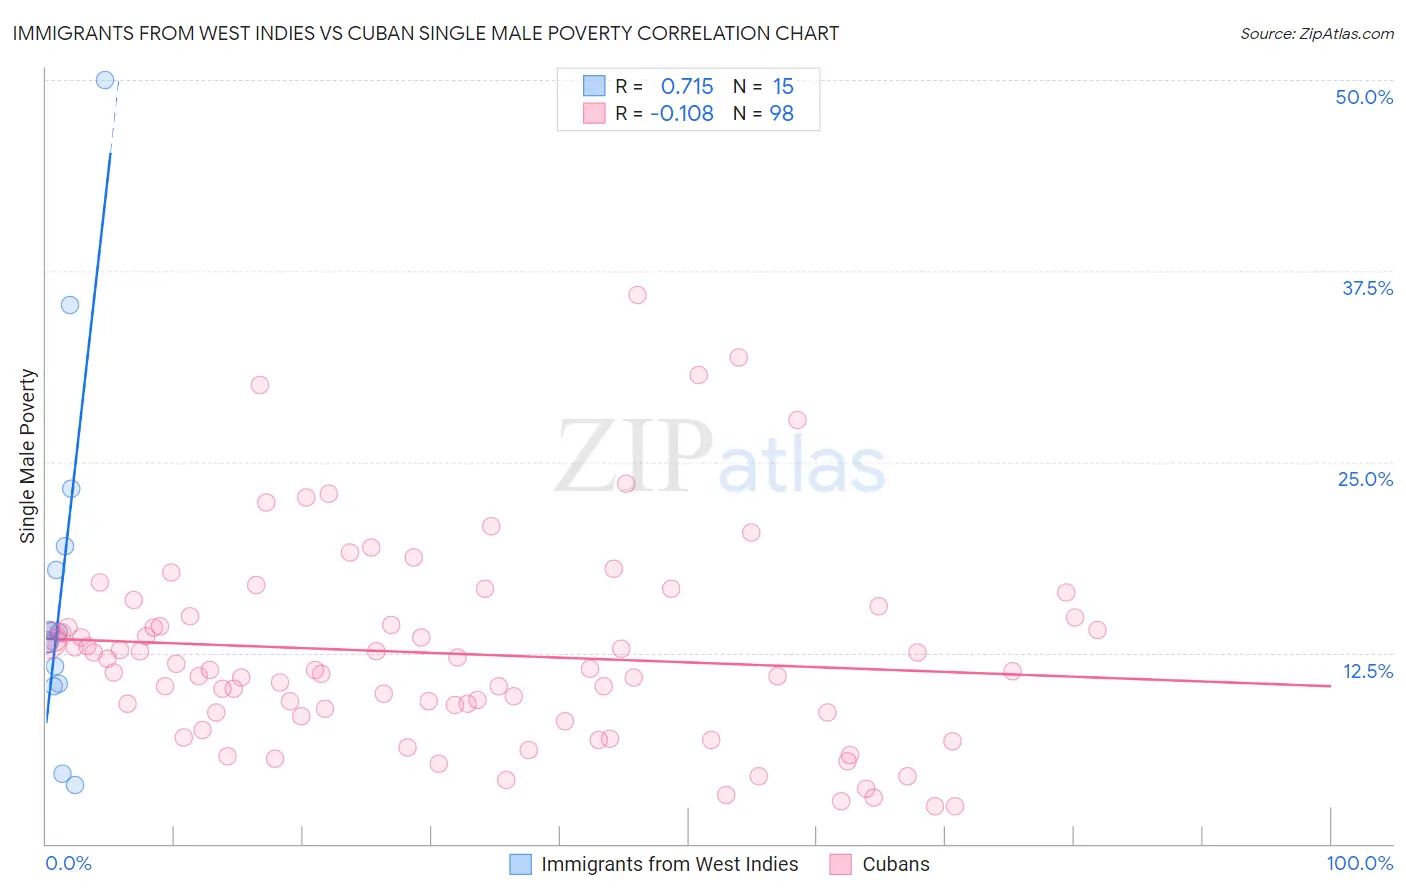
Immigrants from West Indies vs Cuban Single Male Poverty Correlation Chart
The statistical analysis conducted on geographies consisting of 70,729,922 people shows a strong positive correlation between the proportion of Immigrants from West Indies and poverty level among single males in the United States with a correlation coefficient (R) of 0.715 and weighted average of 12.9%. Similarly, the statistical analysis conducted on geographies consisting of 395,594,477 people shows a poor negative correlation between the proportion of Cubans and poverty level among single males in the United States with a correlation coefficient (R) of -0.108 and weighted average of 12.6%, a difference of 2.8%.
Single Male Poverty Correlation Summary
| Measurement | Immigrants from West Indies | Cuban |
| Minimum | 3.8% | 2.4% |
| Maximum | 50.0% | 35.9% |
| Range | 46.2% | 33.4% |
| Mean | 17.0% | 12.4% |
| Median | 13.8% | 11.4% |
| Interquartile 25% (IQ1) | 10.5% | 8.6% |
| Interquartile 75% (IQ3) | 19.5% | 14.8% |
| Interquartile Range (IQR) | 9.0% | 6.2% |
| Standard Deviation (Sample) | 11.9% | 6.5% |
| Standard Deviation (Population) | 11.5% | 6.5% |
Similar Demographics by Single Male Poverty
Demographics Similar to Immigrants from West Indies by Single Male Poverty
In terms of single male poverty, the demographic groups most similar to Immigrants from West Indies are Immigrants from Trinidad and Tobago (12.9%, a difference of 0.030%), Norwegian (12.9%, a difference of 0.060%), Nigerian (12.9%, a difference of 0.060%), Immigrants from Kuwait (12.9%, a difference of 0.060%), and Macedonian (12.9%, a difference of 0.090%).
| Demographics | Rating | Rank | Single Male Poverty |
| Syrians | 48.4 /100 | #176 | Average 12.8% |
| Immigrants | Canada | 44.8 /100 | #177 | Average 12.8% |
| Immigrants | Switzerland | 43.1 /100 | #178 | Average 12.8% |
| Israelis | 41.0 /100 | #179 | Average 12.9% |
| Immigrants | North America | 37.7 /100 | #180 | Fair 12.9% |
| Panamanians | 37.6 /100 | #181 | Fair 12.9% |
| Moroccans | 36.8 /100 | #182 | Fair 12.9% |
| Immigrants | West Indies | 33.0 /100 | #183 | Fair 12.9% |
| Immigrants | Trinidad and Tobago | 32.5 /100 | #184 | Fair 12.9% |
| Norwegians | 32.0 /100 | #185 | Fair 12.9% |
| Nigerians | 31.9 /100 | #186 | Fair 12.9% |
| Immigrants | Kuwait | 31.9 /100 | #187 | Fair 12.9% |
| Macedonians | 31.5 /100 | #188 | Fair 12.9% |
| Portuguese | 30.2 /100 | #189 | Fair 12.9% |
| Arabs | 27.0 /100 | #190 | Fair 13.0% |
Demographics Similar to Cubans by Single Male Poverty
In terms of single male poverty, the demographic groups most similar to Cubans are Immigrants from El Salvador (12.6%, a difference of 0.010%), Ukrainian (12.6%, a difference of 0.070%), Immigrants from Zimbabwe (12.6%, a difference of 0.15%), Immigrants from Costa Rica (12.5%, a difference of 0.18%), and Immigrants from Austria (12.5%, a difference of 0.18%).
| Demographics | Rating | Rank | Single Male Poverty |
| Salvadorans | 83.7 /100 | #132 | Excellent 12.5% |
| Immigrants | Western Asia | 83.4 /100 | #133 | Excellent 12.5% |
| Immigrants | Ecuador | 82.1 /100 | #134 | Excellent 12.5% |
| Immigrants | Costa Rica | 81.9 /100 | #135 | Excellent 12.5% |
| Immigrants | Austria | 81.9 /100 | #136 | Excellent 12.5% |
| Ukrainians | 80.7 /100 | #137 | Excellent 12.6% |
| Immigrants | El Salvador | 80.0 /100 | #138 | Excellent 12.6% |
| Cubans | 79.9 /100 | #139 | Good 12.6% |
| Immigrants | Zimbabwe | 78.0 /100 | #140 | Good 12.6% |
| Okinawans | 75.9 /100 | #141 | Good 12.6% |
| Immigrants | Uganda | 75.9 /100 | #142 | Good 12.6% |
| Immigrants | France | 75.8 /100 | #143 | Good 12.6% |
| Hawaiians | 75.1 /100 | #144 | Good 12.6% |
| Immigrants | Lebanon | 75.0 /100 | #145 | Good 12.6% |
| Native Hawaiians | 75.0 /100 | #146 | Good 12.6% |