Korean vs Cuban Median Earnings
COMPARE
Korean
Cuban
Median Earnings
Median Earnings Comparison
Koreans
Cubans
$48,727
MEDIAN EARNINGS
96.2/ 100
METRIC RATING
116th/ 347
METRIC RANK
$40,619
MEDIAN EARNINGS
0.0/ 100
METRIC RATING
308th/ 347
METRIC RANK
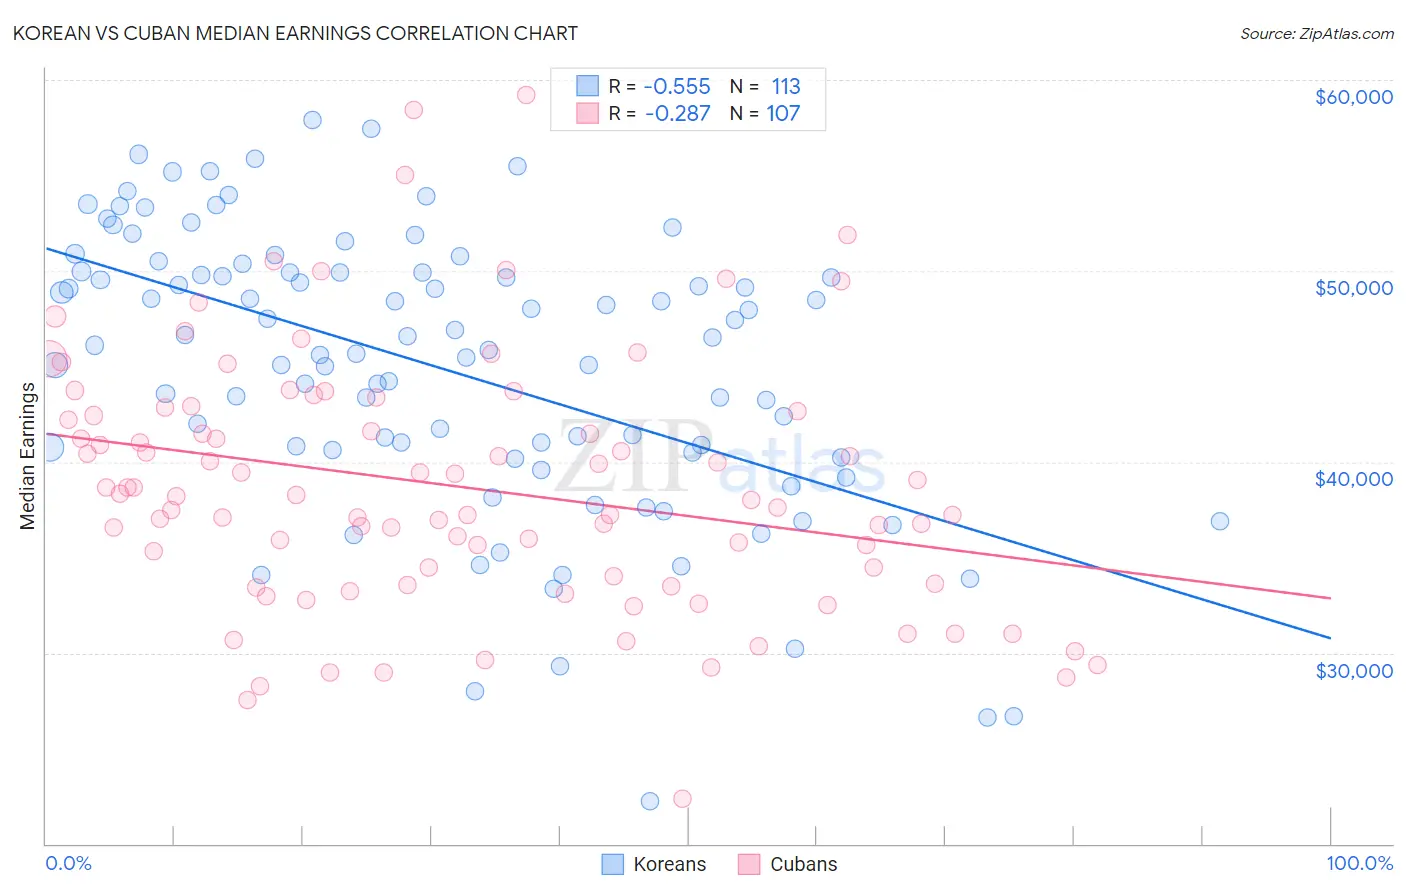
Korean vs Cuban Median Earnings Correlation Chart
The statistical analysis conducted on geographies consisting of 510,900,863 people shows a substantial negative correlation between the proportion of Koreans and median earnings in the United States with a correlation coefficient (R) of -0.555 and weighted average of $48,727. Similarly, the statistical analysis conducted on geographies consisting of 449,351,529 people shows a weak negative correlation between the proportion of Cubans and median earnings in the United States with a correlation coefficient (R) of -0.287 and weighted average of $40,619, a difference of 20.0%.
Median Earnings Correlation Summary
| Measurement | Korean | Cuban |
| Minimum | $22,216 | $22,371 |
| Maximum | $57,875 | $59,236 |
| Range | $35,659 | $36,865 |
| Mean | $44,924 | $38,708 |
| Median | $46,110 | $38,230 |
| Interquartile 25% (IQ1) | $40,528 | $33,586 |
| Interquartile 75% (IQ3) | $49,935 | $42,663 |
| Interquartile Range (IQR) | $9,407 | $9,077 |
| Standard Deviation (Sample) | $7,353 | $6,670 |
| Standard Deviation (Population) | $7,320 | $6,639 |
Similar Demographics by Median Earnings
Demographics Similar to Koreans by Median Earnings
In terms of median earnings, the demographic groups most similar to Koreans are Serbian ($48,677, a difference of 0.10%), Immigrants from Jordan ($48,673, a difference of 0.11%), Polish ($48,659, a difference of 0.14%), Chinese ($48,836, a difference of 0.22%), and Moroccan ($48,838, a difference of 0.23%).
| Demographics | Rating | Rank | Median Earnings |
| Syrians | 97.1 /100 | #109 | Exceptional $48,934 |
| Immigrants | Ethiopia | 97.1 /100 | #110 | Exceptional $48,924 |
| Immigrants | Zimbabwe | 97.0 /100 | #111 | Exceptional $48,913 |
| Northern Europeans | 96.9 /100 | #112 | Exceptional $48,887 |
| Immigrants | Kuwait | 96.8 /100 | #113 | Exceptional $48,861 |
| Moroccans | 96.7 /100 | #114 | Exceptional $48,838 |
| Chinese | 96.7 /100 | #115 | Exceptional $48,836 |
| Koreans | 96.2 /100 | #116 | Exceptional $48,727 |
| Serbians | 95.9 /100 | #117 | Exceptional $48,677 |
| Immigrants | Jordan | 95.9 /100 | #118 | Exceptional $48,673 |
| Poles | 95.8 /100 | #119 | Exceptional $48,659 |
| Carpatho Rusyns | 95.5 /100 | #120 | Exceptional $48,617 |
| Arabs | 95.4 /100 | #121 | Exceptional $48,599 |
| Chileans | 94.8 /100 | #122 | Exceptional $48,504 |
| Immigrants | Syria | 93.9 /100 | #123 | Exceptional $48,375 |
Demographics Similar to Cubans by Median Earnings
In terms of median earnings, the demographic groups most similar to Cubans are Honduran ($40,638, a difference of 0.050%), Yaqui ($40,647, a difference of 0.070%), Chickasaw ($40,672, a difference of 0.13%), Immigrants from Haiti ($40,550, a difference of 0.17%), and Immigrants from Guatemala ($40,851, a difference of 0.57%).
| Demographics | Rating | Rank | Median Earnings |
| Immigrants | Latin America | 0.1 /100 | #301 | Tragic $41,049 |
| Shoshone | 0.0 /100 | #302 | Tragic $40,932 |
| Haitians | 0.0 /100 | #303 | Tragic $40,918 |
| Immigrants | Guatemala | 0.0 /100 | #304 | Tragic $40,851 |
| Chickasaw | 0.0 /100 | #305 | Tragic $40,672 |
| Yaqui | 0.0 /100 | #306 | Tragic $40,647 |
| Hondurans | 0.0 /100 | #307 | Tragic $40,638 |
| Cubans | 0.0 /100 | #308 | Tragic $40,619 |
| Immigrants | Haiti | 0.0 /100 | #309 | Tragic $40,550 |
| Apache | 0.0 /100 | #310 | Tragic $40,388 |
| Hispanics or Latinos | 0.0 /100 | #311 | Tragic $40,288 |
| Chippewa | 0.0 /100 | #312 | Tragic $40,287 |
| Choctaw | 0.0 /100 | #313 | Tragic $40,270 |
| Cheyenne | 0.0 /100 | #314 | Tragic $40,233 |
| Seminole | 0.0 /100 | #315 | Tragic $40,233 |