Kiowa vs Belgian Male Poverty
COMPARE
Kiowa
Belgian
Male Poverty
Male Poverty Comparison
Kiowa
Belgians
15.2%
MALE POVERTY
0.0/ 100
METRIC RATING
322nd/ 347
METRIC RANK
10.3%
MALE POVERTY
95.9/ 100
METRIC RATING
81st/ 347
METRIC RANK
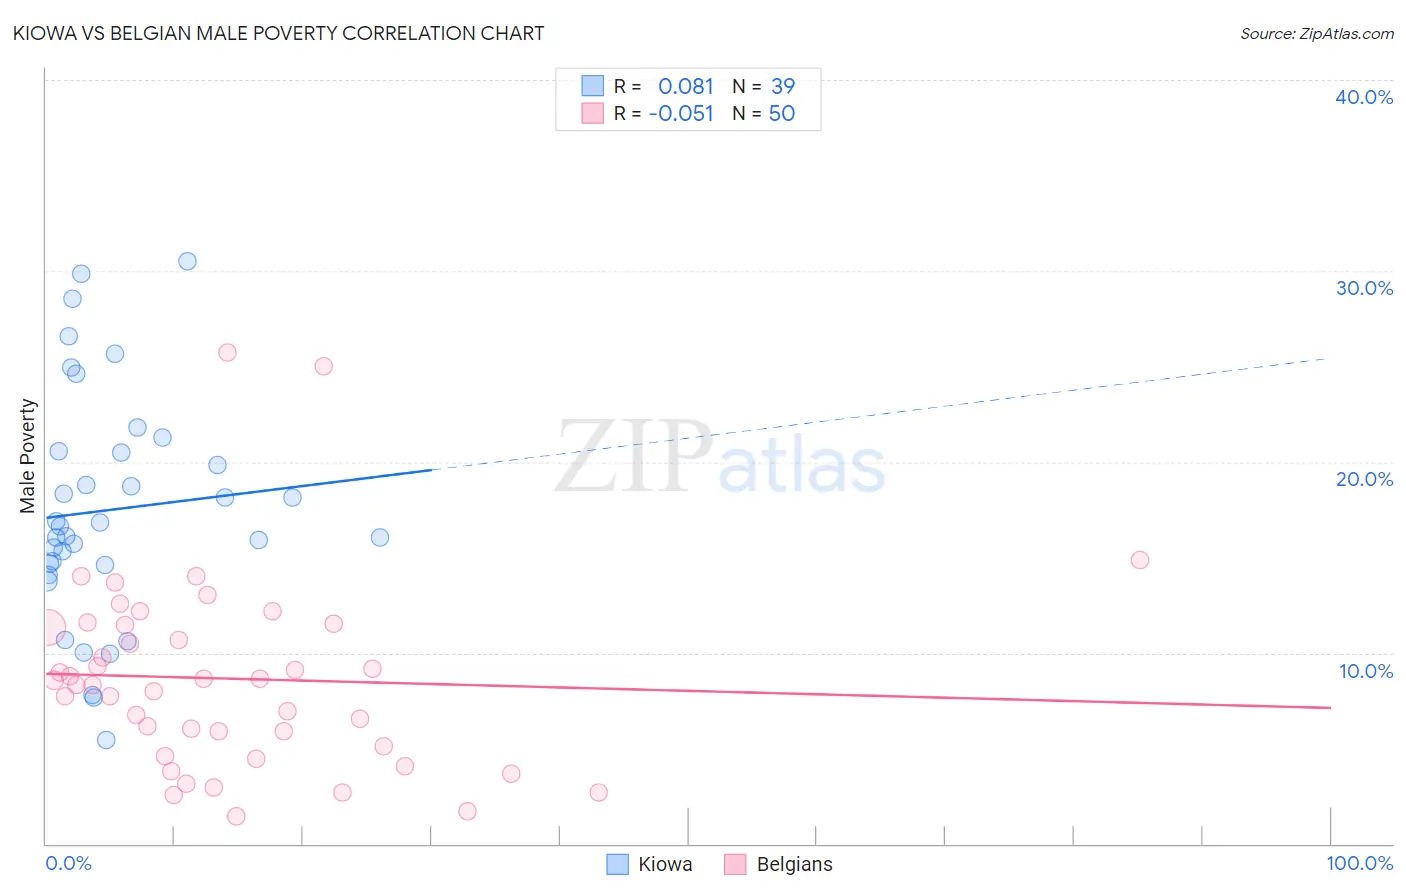
Kiowa vs Belgian Male Poverty Correlation Chart
The statistical analysis conducted on geographies consisting of 56,098,824 people shows a slight positive correlation between the proportion of Kiowa and poverty level among males in the United States with a correlation coefficient (R) of 0.081 and weighted average of 15.2%. Similarly, the statistical analysis conducted on geographies consisting of 355,745,513 people shows a slight negative correlation between the proportion of Belgians and poverty level among males in the United States with a correlation coefficient (R) of -0.051 and weighted average of 10.3%, a difference of 47.1%.
Male Poverty Correlation Summary
| Measurement | Kiowa | Belgian |
| Minimum | 5.5% | 1.4% |
| Maximum | 30.5% | 25.7% |
| Range | 25.0% | 24.3% |
| Mean | 17.5% | 8.6% |
| Median | 16.7% | 8.5% |
| Interquartile 25% (IQ1) | 14.6% | 5.1% |
| Interquartile 75% (IQ3) | 20.6% | 11.4% |
| Interquartile Range (IQR) | 6.0% | 6.4% |
| Standard Deviation (Sample) | 6.0% | 5.0% |
| Standard Deviation (Population) | 5.9% | 4.9% |
Similar Demographics by Male Poverty
Demographics Similar to Kiowa by Male Poverty
In terms of male poverty, the demographic groups most similar to Kiowa are Colville (15.2%, a difference of 0.39%), Menominee (15.3%, a difference of 0.58%), Arapaho (15.1%, a difference of 0.72%), Yakama (15.3%, a difference of 0.76%), and Central American Indian (15.3%, a difference of 0.87%).
| Demographics | Rating | Rank | Male Poverty |
| Chippewa | 0.0 /100 | #315 | Tragic 14.6% |
| British West Indians | 0.0 /100 | #316 | Tragic 14.6% |
| Immigrants | Dominica | 0.0 /100 | #317 | Tragic 14.7% |
| Immigrants | Grenada | 0.0 /100 | #318 | Tragic 14.7% |
| U.S. Virgin Islanders | 0.0 /100 | #319 | Tragic 14.7% |
| Immigrants | Congo | 0.0 /100 | #320 | Tragic 14.7% |
| Arapaho | 0.0 /100 | #321 | Tragic 15.1% |
| Kiowa | 0.0 /100 | #322 | Tragic 15.2% |
| Colville | 0.0 /100 | #323 | Tragic 15.2% |
| Menominee | 0.0 /100 | #324 | Tragic 15.3% |
| Yakama | 0.0 /100 | #325 | Tragic 15.3% |
| Central American Indians | 0.0 /100 | #326 | Tragic 15.3% |
| Paiute | 0.0 /100 | #327 | Tragic 15.8% |
| Blacks/African Americans | 0.0 /100 | #328 | Tragic 15.8% |
| Dominicans | 0.0 /100 | #329 | Tragic 16.1% |
Demographics Similar to Belgians by Male Poverty
In terms of male poverty, the demographic groups most similar to Belgians are Egyptian (10.3%, a difference of 0.0%), Immigrants from Sweden (10.3%, a difference of 0.13%), Czechoslovakian (10.3%, a difference of 0.19%), Immigrants from England (10.4%, a difference of 0.24%), and Immigrants from Eastern Asia (10.4%, a difference of 0.37%).
| Demographics | Rating | Rank | Male Poverty |
| Immigrants | Eastern Europe | 96.9 /100 | #74 | Exceptional 10.2% |
| Carpatho Rusyns | 96.9 /100 | #75 | Exceptional 10.2% |
| Dutch | 96.9 /100 | #76 | Exceptional 10.2% |
| Immigrants | Belgium | 96.8 /100 | #77 | Exceptional 10.3% |
| Irish | 96.8 /100 | #78 | Exceptional 10.3% |
| Immigrants | North America | 96.5 /100 | #79 | Exceptional 10.3% |
| English | 96.4 /100 | #80 | Exceptional 10.3% |
| Belgians | 95.9 /100 | #81 | Exceptional 10.3% |
| Egyptians | 95.9 /100 | #82 | Exceptional 10.3% |
| Immigrants | Sweden | 95.7 /100 | #83 | Exceptional 10.3% |
| Czechoslovakians | 95.6 /100 | #84 | Exceptional 10.3% |
| Immigrants | England | 95.5 /100 | #85 | Exceptional 10.4% |
| Immigrants | Eastern Asia | 95.3 /100 | #86 | Exceptional 10.4% |
| Northern Europeans | 95.2 /100 | #87 | Exceptional 10.4% |
| Cambodians | 95.0 /100 | #88 | Exceptional 10.4% |