Japanese vs Immigrants from Germany GED/Equivalency
COMPARE
Japanese
Immigrants from Germany
GED/Equivalency
GED/Equivalency Comparison
Japanese
Immigrants from Germany
82.4%
GED/EQUIVALENCY
0.0/ 100
METRIC RATING
287th/ 347
METRIC RANK
86.7%
GED/EQUIVALENCY
88.8/ 100
METRIC RATING
130th/ 347
METRIC RANK
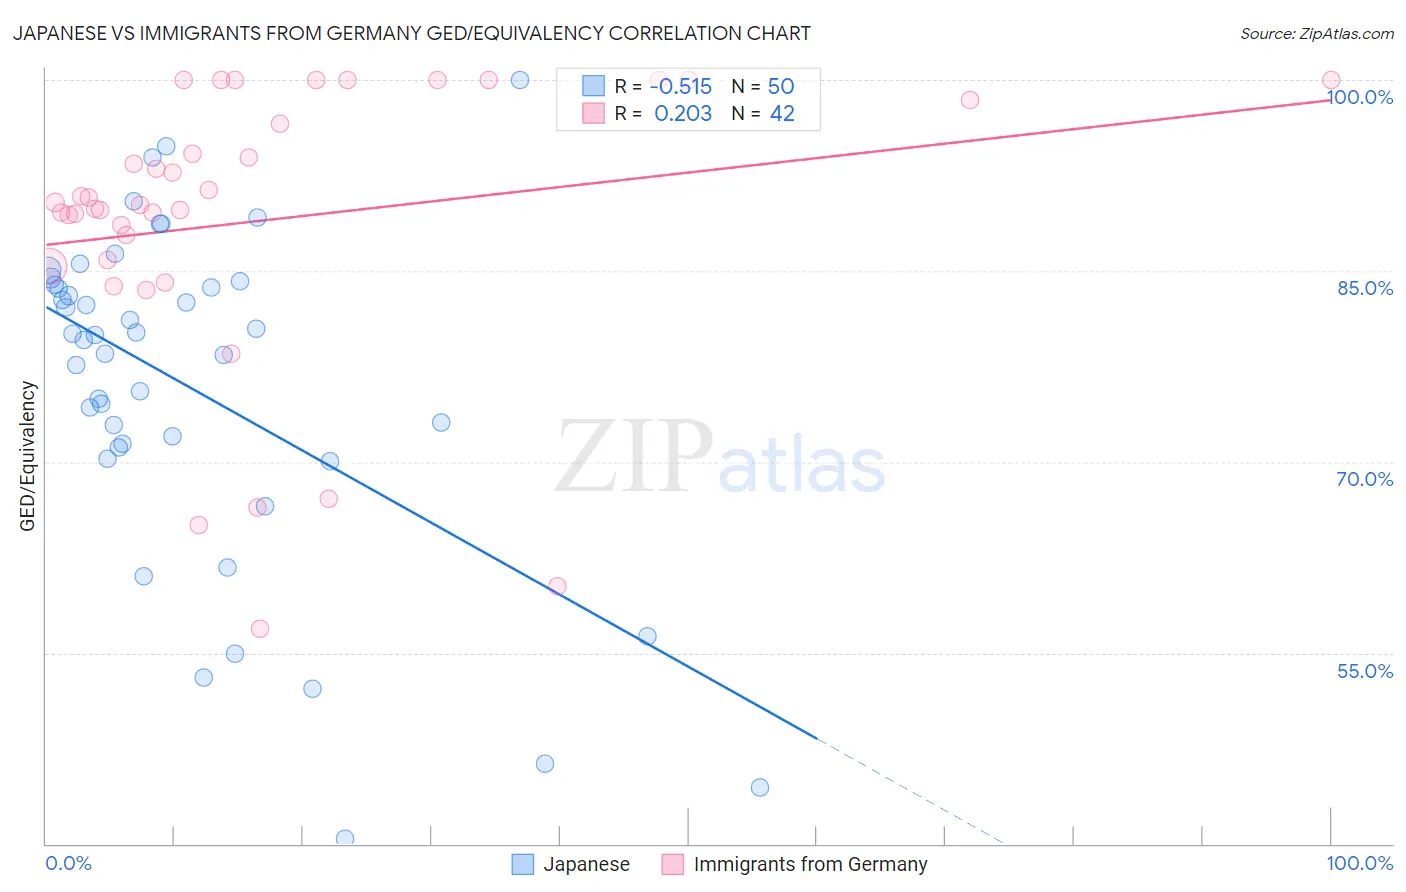
Japanese vs Immigrants from Germany GED/Equivalency Correlation Chart
The statistical analysis conducted on geographies consisting of 249,183,224 people shows a substantial negative correlation between the proportion of Japanese and percentage of population with at least ged/equivalency education in the United States with a correlation coefficient (R) of -0.515 and weighted average of 82.4%. Similarly, the statistical analysis conducted on geographies consisting of 463,886,920 people shows a weak positive correlation between the proportion of Immigrants from Germany and percentage of population with at least ged/equivalency education in the United States with a correlation coefficient (R) of 0.203 and weighted average of 86.7%, a difference of 5.2%.
GED/Equivalency Correlation Summary
| Measurement | Japanese | Immigrants from Germany |
| Minimum | 40.4% | 56.9% |
| Maximum | 100.0% | 100.0% |
| Range | 59.6% | 43.1% |
| Mean | 75.8% | 89.0% |
| Median | 79.8% | 90.3% |
| Interquartile 25% (IQ1) | 71.1% | 85.9% |
| Interquartile 75% (IQ3) | 83.9% | 98.4% |
| Interquartile Range (IQR) | 12.8% | 12.6% |
| Standard Deviation (Sample) | 13.3% | 11.2% |
| Standard Deviation (Population) | 13.1% | 11.0% |
Similar Demographics by GED/Equivalency
Demographics Similar to Japanese by GED/Equivalency
In terms of ged/equivalency, the demographic groups most similar to Japanese are Immigrants from West Indies (82.4%, a difference of 0.020%), Cajun (82.4%, a difference of 0.040%), Immigrants from Barbados (82.4%, a difference of 0.070%), Pueblo (82.3%, a difference of 0.10%), and Immigrants from Cambodia (82.2%, a difference of 0.18%).
| Demographics | Rating | Rank | GED/Equivalency |
| Cheyenne | 0.1 /100 | #280 | Tragic 82.7% |
| Sioux | 0.1 /100 | #281 | Tragic 82.6% |
| Immigrants | Immigrants | 0.1 /100 | #282 | Tragic 82.6% |
| Indonesians | 0.1 /100 | #283 | Tragic 82.5% |
| Immigrants | Barbados | 0.1 /100 | #284 | Tragic 82.4% |
| Cajuns | 0.0 /100 | #285 | Tragic 82.4% |
| Immigrants | West Indies | 0.0 /100 | #286 | Tragic 82.4% |
| Japanese | 0.0 /100 | #287 | Tragic 82.4% |
| Pueblo | 0.0 /100 | #288 | Tragic 82.3% |
| Immigrants | Cambodia | 0.0 /100 | #289 | Tragic 82.2% |
| Haitians | 0.0 /100 | #290 | Tragic 82.1% |
| Cubans | 0.0 /100 | #291 | Tragic 82.0% |
| Paiute | 0.0 /100 | #292 | Tragic 82.0% |
| British West Indians | 0.0 /100 | #293 | Tragic 82.0% |
| Immigrants | St. Vincent and the Grenadines | 0.0 /100 | #294 | Tragic 82.0% |
Demographics Similar to Immigrants from Germany by GED/Equivalency
In terms of ged/equivalency, the demographic groups most similar to Immigrants from Germany are Immigrants from Ukraine (86.7%, a difference of 0.0%), Immigrants from Spain (86.7%, a difference of 0.020%), Immigrants from Brazil (86.6%, a difference of 0.020%), Yugoslavian (86.7%, a difference of 0.030%), and Tsimshian (86.6%, a difference of 0.030%).
| Demographics | Rating | Rank | GED/Equivalency |
| Immigrants | Italy | 90.5 /100 | #123 | Exceptional 86.7% |
| Immigrants | Egypt | 90.4 /100 | #124 | Exceptional 86.7% |
| Celtics | 90.4 /100 | #125 | Exceptional 86.7% |
| Asians | 90.3 /100 | #126 | Exceptional 86.7% |
| Argentineans | 89.7 /100 | #127 | Excellent 86.7% |
| Yugoslavians | 89.5 /100 | #128 | Excellent 86.7% |
| Immigrants | Ukraine | 88.9 /100 | #129 | Excellent 86.7% |
| Immigrants | Germany | 88.8 /100 | #130 | Excellent 86.7% |
| Immigrants | Spain | 88.5 /100 | #131 | Excellent 86.7% |
| Immigrants | Brazil | 88.4 /100 | #132 | Excellent 86.6% |
| Tsimshian | 88.3 /100 | #133 | Excellent 86.6% |
| Albanians | 87.7 /100 | #134 | Excellent 86.6% |
| Immigrants | Asia | 87.4 /100 | #135 | Excellent 86.6% |
| Chileans | 86.9 /100 | #136 | Excellent 86.6% |
| Arabs | 86.7 /100 | #137 | Excellent 86.6% |