Japanese vs Immigrants from Germany Female Unemployment
COMPARE
Japanese
Immigrants from Germany
Female Unemployment
Female Unemployment Comparison
Japanese
Immigrants from Germany
5.6%
FEMALE UNEMPLOYMENT
1.2/ 100
METRIC RATING
246th/ 347
METRIC RANK
5.1%
FEMALE UNEMPLOYMENT
87.6/ 100
METRIC RATING
122nd/ 347
METRIC RANK
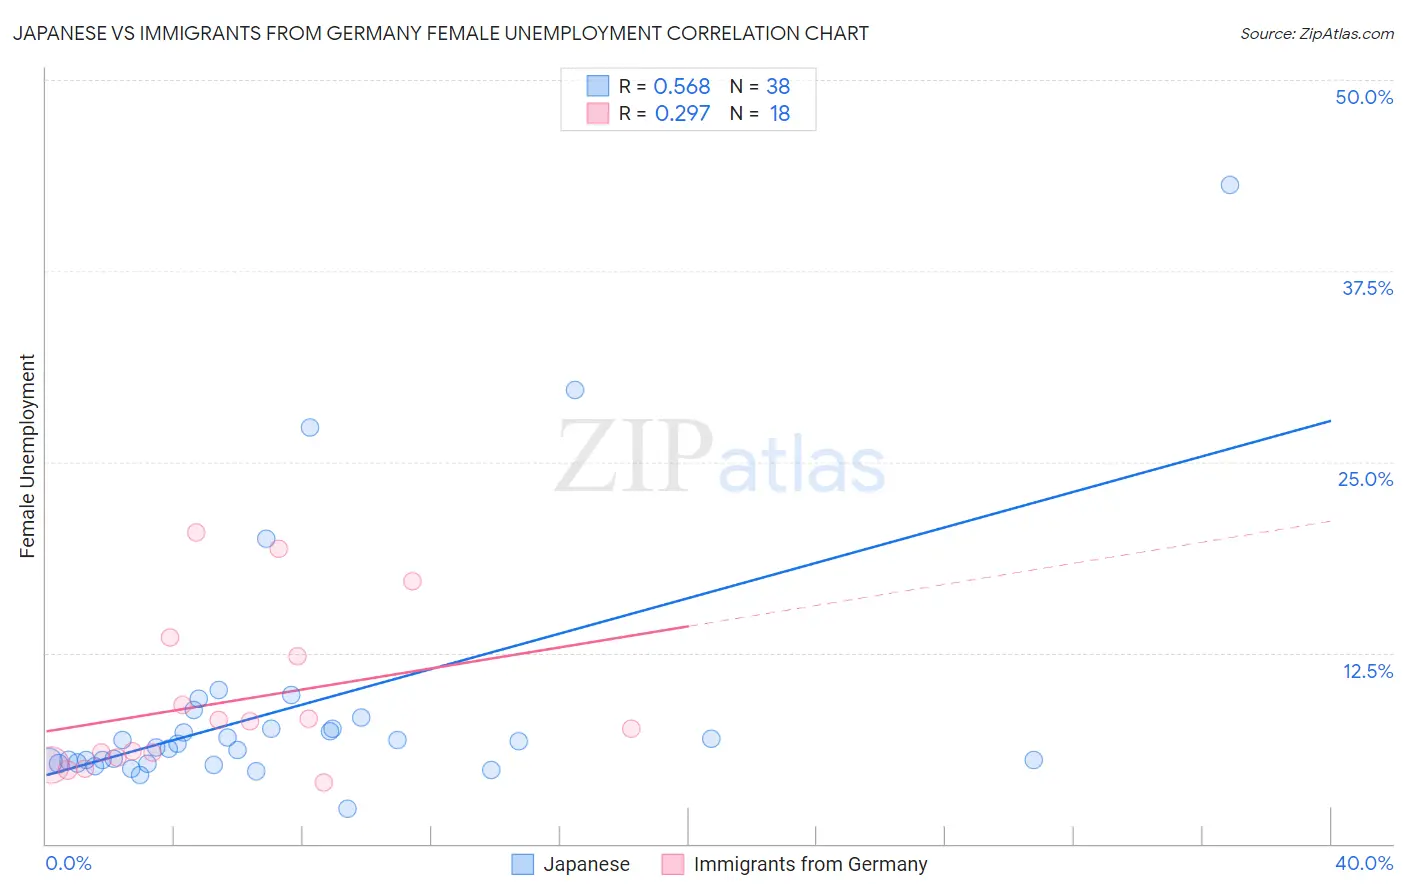
Japanese vs Immigrants from Germany Female Unemployment Correlation Chart
The statistical analysis conducted on geographies consisting of 248,709,306 people shows a substantial positive correlation between the proportion of Japanese and unemploymnet rate among females in the United States with a correlation coefficient (R) of 0.568 and weighted average of 5.6%. Similarly, the statistical analysis conducted on geographies consisting of 460,161,850 people shows a weak positive correlation between the proportion of Immigrants from Germany and unemploymnet rate among females in the United States with a correlation coefficient (R) of 0.297 and weighted average of 5.1%, a difference of 9.9%.
Female Unemployment Correlation Summary
| Measurement | Japanese | Immigrants from Germany |
| Minimum | 2.3% | 4.0% |
| Maximum | 43.1% | 20.3% |
| Range | 40.8% | 16.4% |
| Mean | 8.8% | 9.2% |
| Median | 6.4% | 7.7% |
| Interquartile 25% (IQ1) | 5.3% | 5.6% |
| Interquartile 75% (IQ3) | 7.5% | 12.3% |
| Interquartile Range (IQR) | 2.3% | 6.6% |
| Standard Deviation (Sample) | 8.0% | 5.1% |
| Standard Deviation (Population) | 7.9% | 5.0% |
Similar Demographics by Female Unemployment
Demographics Similar to Japanese by Female Unemployment
In terms of female unemployment, the demographic groups most similar to Japanese are Immigrants from Western Asia (5.6%, a difference of 0.080%), Guamanian/Chamorro (5.6%, a difference of 0.23%), Cree (5.6%, a difference of 0.24%), Immigrants from Uzbekistan (5.6%, a difference of 0.28%), and Immigrants from Liberia (5.6%, a difference of 0.37%).
| Demographics | Rating | Rank | Female Unemployment |
| Aleuts | 3.0 /100 | #239 | Tragic 5.5% |
| Immigrants | South America | 2.9 /100 | #240 | Tragic 5.5% |
| South American Indians | 2.8 /100 | #241 | Tragic 5.5% |
| Marshallese | 2.3 /100 | #242 | Tragic 5.6% |
| Spanish Americans | 2.2 /100 | #243 | Tragic 5.6% |
| Immigrants | Liberia | 1.5 /100 | #244 | Tragic 5.6% |
| Guamanians/Chamorros | 1.4 /100 | #245 | Tragic 5.6% |
| Japanese | 1.2 /100 | #246 | Tragic 5.6% |
| Immigrants | Western Asia | 1.1 /100 | #247 | Tragic 5.6% |
| Cree | 1.0 /100 | #248 | Tragic 5.6% |
| Immigrants | Uzbekistan | 1.0 /100 | #249 | Tragic 5.6% |
| Immigrants | Syria | 0.8 /100 | #250 | Tragic 5.6% |
| Assyrians/Chaldeans/Syriacs | 0.8 /100 | #251 | Tragic 5.6% |
| Cajuns | 0.7 /100 | #252 | Tragic 5.7% |
| Immigrants | Sierra Leone | 0.6 /100 | #253 | Tragic 5.7% |
Demographics Similar to Immigrants from Germany by Female Unemployment
In terms of female unemployment, the demographic groups most similar to Immigrants from Germany are Immigrants from South Africa (5.1%, a difference of 0.0%), Immigrants from Europe (5.1%, a difference of 0.050%), Immigrants from Romania (5.1%, a difference of 0.080%), Immigrants from Western Europe (5.1%, a difference of 0.080%), and Immigrants from North Macedonia (5.1%, a difference of 0.10%).
| Demographics | Rating | Rank | Female Unemployment |
| Lebanese | 91.0 /100 | #115 | Exceptional 5.1% |
| Americans | 90.5 /100 | #116 | Exceptional 5.1% |
| Jordanians | 90.3 /100 | #117 | Exceptional 5.1% |
| Immigrants | Croatia | 89.9 /100 | #118 | Excellent 5.1% |
| Immigrants | North Macedonia | 88.3 /100 | #119 | Excellent 5.1% |
| Immigrants | Romania | 88.1 /100 | #120 | Excellent 5.1% |
| Immigrants | Western Europe | 88.1 /100 | #121 | Excellent 5.1% |
| Immigrants | Germany | 87.6 /100 | #122 | Excellent 5.1% |
| Immigrants | South Africa | 87.6 /100 | #123 | Excellent 5.1% |
| Immigrants | Europe | 87.2 /100 | #124 | Excellent 5.1% |
| Basques | 86.5 /100 | #125 | Excellent 5.1% |
| Immigrants | Korea | 86.3 /100 | #126 | Excellent 5.1% |
| Immigrants | Hungary | 86.0 /100 | #127 | Excellent 5.1% |
| Chileans | 85.8 /100 | #128 | Excellent 5.1% |
| Ethiopians | 85.7 /100 | #129 | Excellent 5.1% |