Jamaican vs Yaqui Child Poverty Among Girls Under 16
COMPARE
Jamaican
Yaqui
Child Poverty Among Girls Under 16
Child Poverty Among Girls Under 16 Comparison
Jamaicans
Yaqui
19.7%
CHILD POVERTY AMONG GIRLS UNDER 16
0.1/ 100
METRIC RATING
264th/ 347
METRIC RANK
20.3%
CHILD POVERTY AMONG GIRLS UNDER 16
0.0/ 100
METRIC RATING
284th/ 347
METRIC RANK
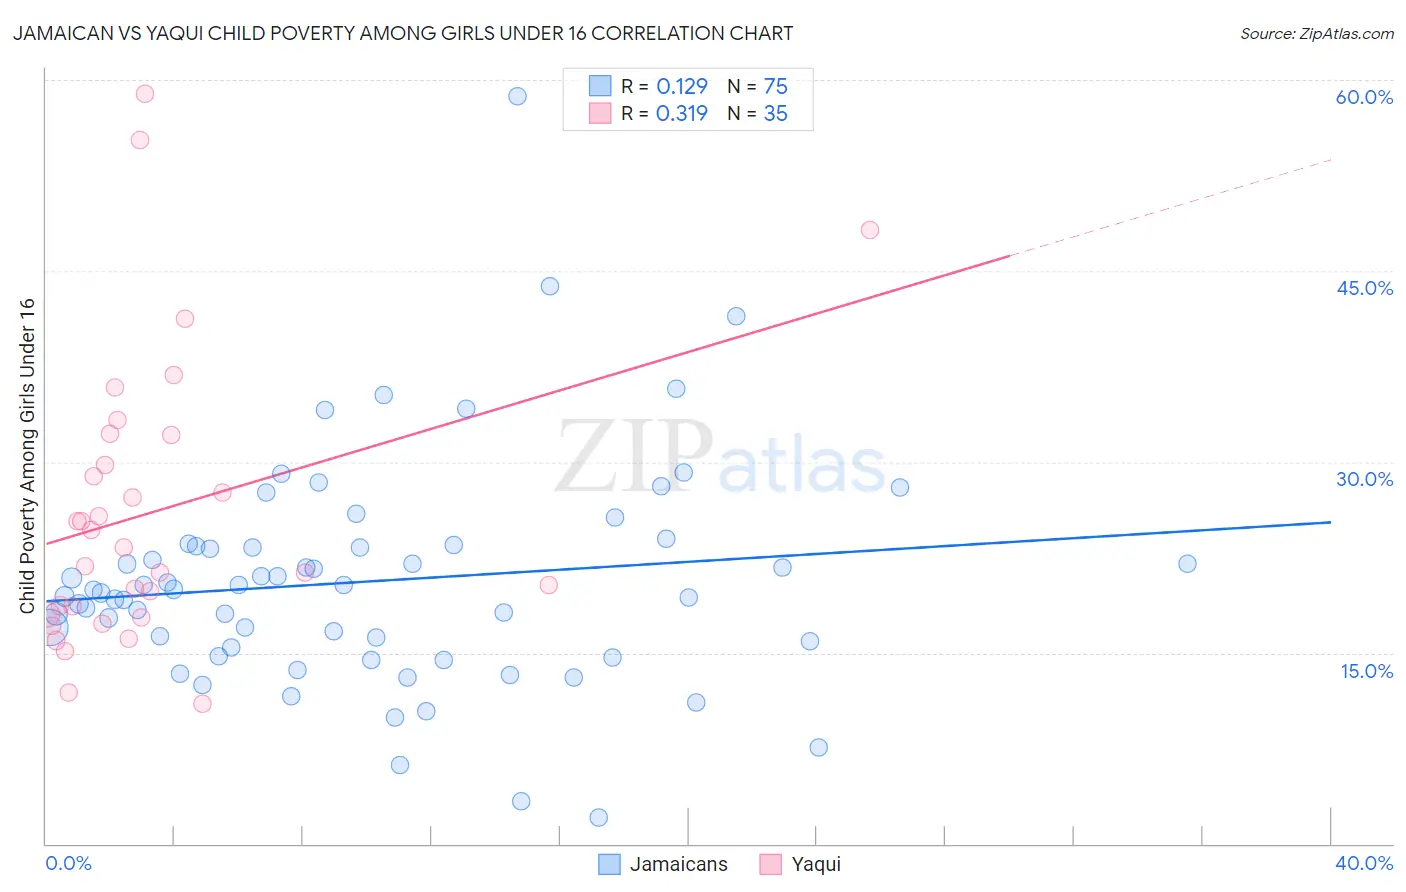
Jamaican vs Yaqui Child Poverty Among Girls Under 16 Correlation Chart
The statistical analysis conducted on geographies consisting of 362,780,888 people shows a poor positive correlation between the proportion of Jamaicans and poverty level among girls under the age of 16 in the United States with a correlation coefficient (R) of 0.129 and weighted average of 19.7%. Similarly, the statistical analysis conducted on geographies consisting of 107,293,356 people shows a mild positive correlation between the proportion of Yaqui and poverty level among girls under the age of 16 in the United States with a correlation coefficient (R) of 0.319 and weighted average of 20.3%, a difference of 3.3%.
Child Poverty Among Girls Under 16 Correlation Summary
| Measurement | Jamaican | Yaqui |
| Minimum | 2.1% | 11.0% |
| Maximum | 58.8% | 58.9% |
| Range | 56.7% | 47.9% |
| Mean | 20.6% | 26.1% |
| Median | 19.9% | 23.3% |
| Interquartile 25% (IQ1) | 15.4% | 18.0% |
| Interquartile 75% (IQ3) | 23.4% | 32.1% |
| Interquartile Range (IQR) | 8.0% | 14.2% |
| Standard Deviation (Sample) | 8.8% | 11.3% |
| Standard Deviation (Population) | 8.8% | 11.2% |
Demographics Similar to Jamaicans and Yaqui by Child Poverty Among Girls Under 16
In terms of child poverty among girls under 16, the demographic groups most similar to Jamaicans are Immigrants from Jamaica (19.8%, a difference of 0.43%), Spanish American (19.8%, a difference of 0.68%), Immigrants from Bangladesh (19.9%, a difference of 0.90%), Spanish American Indian (19.9%, a difference of 0.94%), and Liberian (19.9%, a difference of 1.0%). Similarly, the demographic groups most similar to Yaqui are Senegalese (20.3%, a difference of 0.030%), West Indian (20.3%, a difference of 0.080%), Central American (20.2%, a difference of 0.36%), Immigrants from Liberia (20.2%, a difference of 0.43%), and Immigrants from Zaire (20.2%, a difference of 0.45%).
| Demographics | Rating | Rank | Child Poverty Among Girls Under 16 |
| Jamaicans | 0.1 /100 | #264 | Tragic 19.7% |
| Immigrants | Jamaica | 0.1 /100 | #265 | Tragic 19.8% |
| Spanish Americans | 0.1 /100 | #266 | Tragic 19.8% |
| Immigrants | Bangladesh | 0.1 /100 | #267 | Tragic 19.9% |
| Spanish American Indians | 0.1 /100 | #268 | Tragic 19.9% |
| Liberians | 0.1 /100 | #269 | Tragic 19.9% |
| Cherokee | 0.1 /100 | #270 | Tragic 19.9% |
| Immigrants | Barbados | 0.1 /100 | #271 | Tragic 19.9% |
| Immigrants | El Salvador | 0.1 /100 | #272 | Tragic 20.0% |
| Bangladeshis | 0.1 /100 | #273 | Tragic 20.0% |
| Immigrants | St. Vincent and the Grenadines | 0.0 /100 | #274 | Tragic 20.1% |
| Sub-Saharan Africans | 0.0 /100 | #275 | Tragic 20.1% |
| Comanche | 0.0 /100 | #276 | Tragic 20.2% |
| Belizeans | 0.0 /100 | #277 | Tragic 20.2% |
| Barbadians | 0.0 /100 | #278 | Tragic 20.2% |
| Immigrants | Zaire | 0.0 /100 | #279 | Tragic 20.2% |
| Immigrants | Liberia | 0.0 /100 | #280 | Tragic 20.2% |
| Central Americans | 0.0 /100 | #281 | Tragic 20.2% |
| West Indians | 0.0 /100 | #282 | Tragic 20.3% |
| Senegalese | 0.0 /100 | #283 | Tragic 20.3% |
| Yaqui | 0.0 /100 | #284 | Tragic 20.3% |