Laotian vs Yaqui Child Poverty Among Girls Under 16
COMPARE
Laotian
Yaqui
Child Poverty Among Girls Under 16
Child Poverty Among Girls Under 16 Comparison
Laotians
Yaqui
14.5%
CHILD POVERTY AMONG GIRLS UNDER 16
98.4/ 100
METRIC RATING
67th/ 347
METRIC RANK
20.3%
CHILD POVERTY AMONG GIRLS UNDER 16
0.0/ 100
METRIC RATING
284th/ 347
METRIC RANK
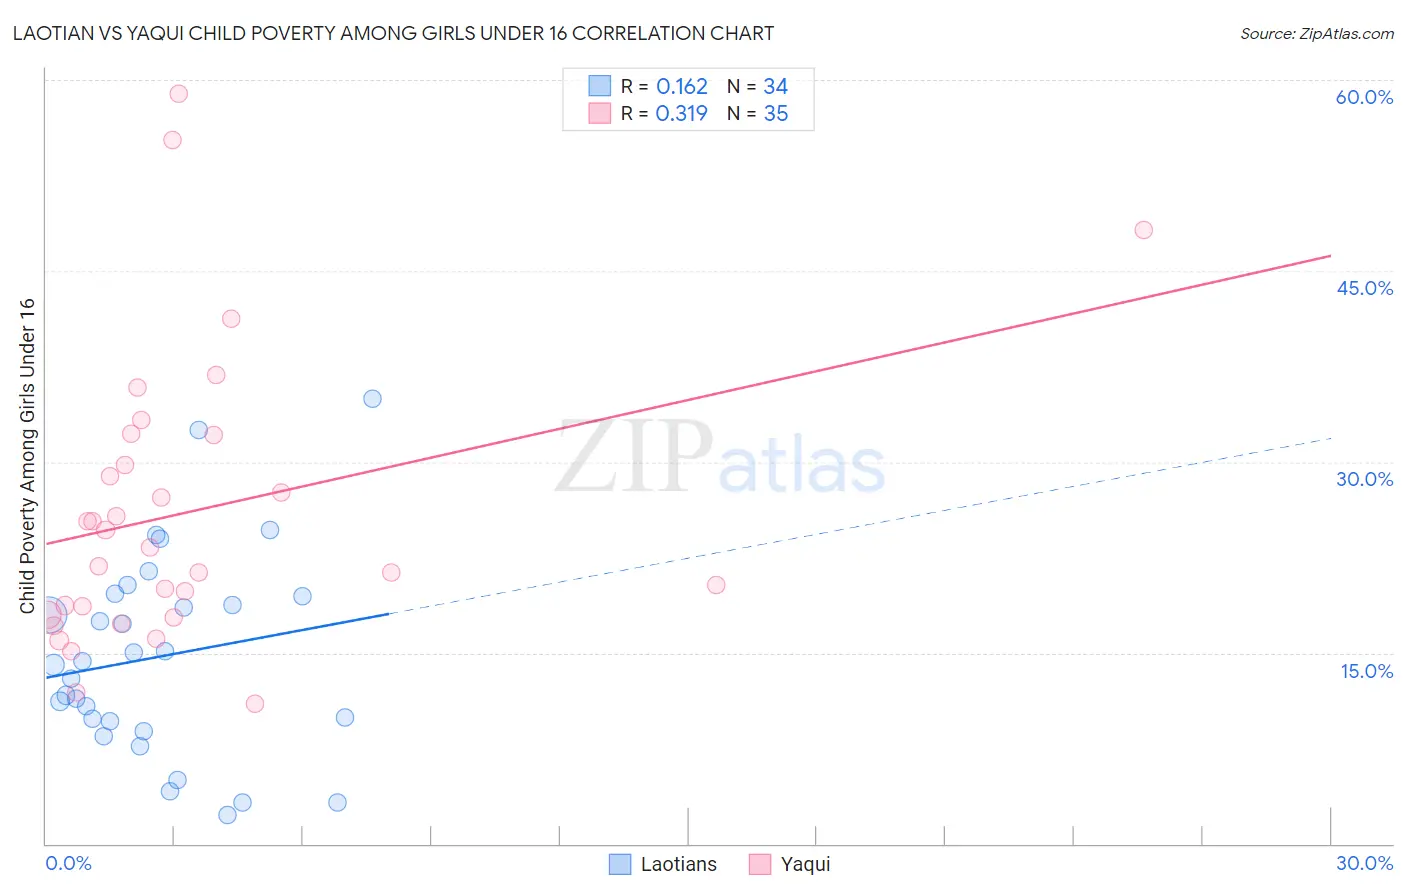
Laotian vs Yaqui Child Poverty Among Girls Under 16 Correlation Chart
The statistical analysis conducted on geographies consisting of 222,726,350 people shows a poor positive correlation between the proportion of Laotians and poverty level among girls under the age of 16 in the United States with a correlation coefficient (R) of 0.162 and weighted average of 14.5%. Similarly, the statistical analysis conducted on geographies consisting of 107,293,356 people shows a mild positive correlation between the proportion of Yaqui and poverty level among girls under the age of 16 in the United States with a correlation coefficient (R) of 0.319 and weighted average of 20.3%, a difference of 39.8%.
Child Poverty Among Girls Under 16 Correlation Summary
| Measurement | Laotian | Yaqui |
| Minimum | 2.3% | 11.0% |
| Maximum | 35.0% | 58.9% |
| Range | 32.7% | 47.9% |
| Mean | 14.7% | 26.1% |
| Median | 14.2% | 23.3% |
| Interquartile 25% (IQ1) | 9.6% | 18.0% |
| Interquartile 75% (IQ3) | 19.4% | 32.1% |
| Interquartile Range (IQR) | 9.8% | 14.2% |
| Standard Deviation (Sample) | 7.9% | 11.3% |
| Standard Deviation (Population) | 7.8% | 11.2% |
Similar Demographics by Child Poverty Among Girls Under 16
Demographics Similar to Laotians by Child Poverty Among Girls Under 16
In terms of child poverty among girls under 16, the demographic groups most similar to Laotians are Immigrants from Argentina (14.6%, a difference of 0.15%), Immigrants from Poland (14.6%, a difference of 0.30%), Immigrants from Belgium (14.5%, a difference of 0.41%), European (14.6%, a difference of 0.43%), and Slovene (14.6%, a difference of 0.46%).
| Demographics | Rating | Rank | Child Poverty Among Girls Under 16 |
| Poles | 98.7 /100 | #60 | Exceptional 14.4% |
| Cambodians | 98.7 /100 | #61 | Exceptional 14.4% |
| Scandinavians | 98.7 /100 | #62 | Exceptional 14.4% |
| Immigrants | Europe | 98.7 /100 | #63 | Exceptional 14.4% |
| Immigrants | Philippines | 98.6 /100 | #64 | Exceptional 14.4% |
| Immigrants | Sweden | 98.6 /100 | #65 | Exceptional 14.5% |
| Immigrants | Belgium | 98.5 /100 | #66 | Exceptional 14.5% |
| Laotians | 98.4 /100 | #67 | Exceptional 14.5% |
| Immigrants | Argentina | 98.3 /100 | #68 | Exceptional 14.6% |
| Immigrants | Poland | 98.2 /100 | #69 | Exceptional 14.6% |
| Europeans | 98.1 /100 | #70 | Exceptional 14.6% |
| Slovenes | 98.1 /100 | #71 | Exceptional 14.6% |
| Immigrants | Netherlands | 98.1 /100 | #72 | Exceptional 14.6% |
| Immigrants | Austria | 98.0 /100 | #73 | Exceptional 14.6% |
| Taiwanese | 98.0 /100 | #74 | Exceptional 14.6% |
Demographics Similar to Yaqui by Child Poverty Among Girls Under 16
In terms of child poverty among girls under 16, the demographic groups most similar to Yaqui are Senegalese (20.3%, a difference of 0.030%), West Indian (20.3%, a difference of 0.080%), Immigrants from Cabo Verde (20.3%, a difference of 0.14%), Central American (20.2%, a difference of 0.36%), and Immigrants from Liberia (20.2%, a difference of 0.43%).
| Demographics | Rating | Rank | Child Poverty Among Girls Under 16 |
| Belizeans | 0.0 /100 | #277 | Tragic 20.2% |
| Barbadians | 0.0 /100 | #278 | Tragic 20.2% |
| Immigrants | Zaire | 0.0 /100 | #279 | Tragic 20.2% |
| Immigrants | Liberia | 0.0 /100 | #280 | Tragic 20.2% |
| Central Americans | 0.0 /100 | #281 | Tragic 20.2% |
| West Indians | 0.0 /100 | #282 | Tragic 20.3% |
| Senegalese | 0.0 /100 | #283 | Tragic 20.3% |
| Yaqui | 0.0 /100 | #284 | Tragic 20.3% |
| Immigrants | Cabo Verde | 0.0 /100 | #285 | Tragic 20.3% |
| Iroquois | 0.0 /100 | #286 | Tragic 20.4% |
| Blackfeet | 0.0 /100 | #287 | Tragic 20.5% |
| Haitians | 0.0 /100 | #288 | Tragic 20.5% |
| Immigrants | Belize | 0.0 /100 | #289 | Tragic 20.6% |
| Immigrants | Haiti | 0.0 /100 | #290 | Tragic 20.6% |
| Chippewa | 0.0 /100 | #291 | Tragic 20.6% |