Jamaican vs Yaqui Ambulatory Disability
COMPARE
Jamaican
Yaqui
Ambulatory Disability
Ambulatory Disability Comparison
Jamaicans
Yaqui
6.7%
AMBULATORY DISABILITY
0.1/ 100
METRIC RATING
277th/ 347
METRIC RANK
6.8%
AMBULATORY DISABILITY
0.0/ 100
METRIC RATING
281st/ 347
METRIC RANK
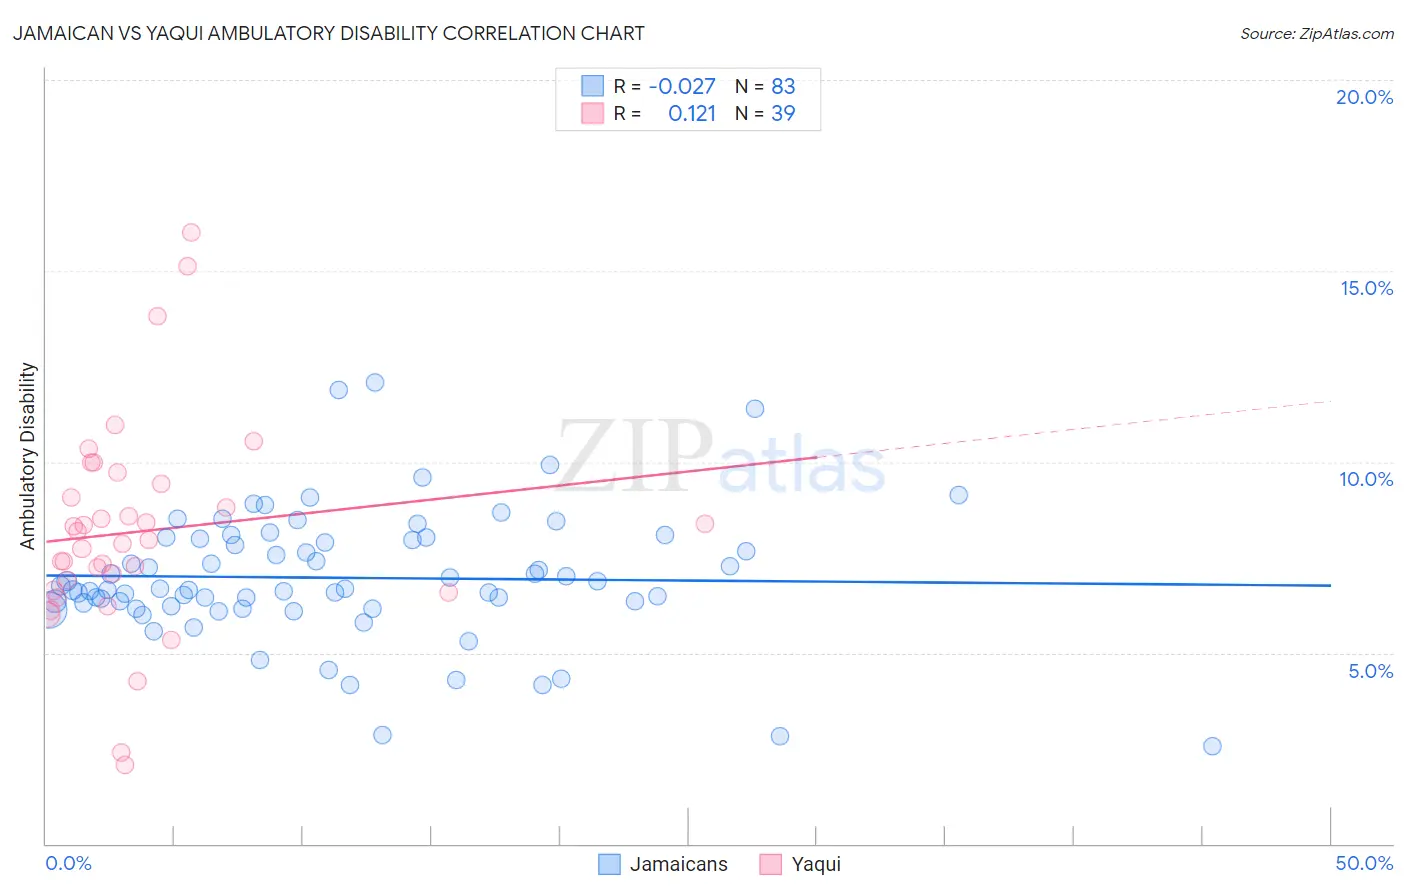
Jamaican vs Yaqui Ambulatory Disability Correlation Chart
The statistical analysis conducted on geographies consisting of 367,821,612 people shows no correlation between the proportion of Jamaicans and percentage of population with ambulatory disability in the United States with a correlation coefficient (R) of -0.027 and weighted average of 6.7%. Similarly, the statistical analysis conducted on geographies consisting of 107,720,926 people shows a poor positive correlation between the proportion of Yaqui and percentage of population with ambulatory disability in the United States with a correlation coefficient (R) of 0.121 and weighted average of 6.8%, a difference of 0.56%.
Ambulatory Disability Correlation Summary
| Measurement | Jamaican | Yaqui |
| Minimum | 2.5% | 2.1% |
| Maximum | 12.1% | 16.0% |
| Range | 9.5% | 13.9% |
| Mean | 7.0% | 8.2% |
| Median | 6.7% | 8.0% |
| Interquartile 25% (IQ1) | 6.2% | 6.6% |
| Interquartile 75% (IQ3) | 8.0% | 9.4% |
| Interquartile Range (IQR) | 1.8% | 2.8% |
| Standard Deviation (Sample) | 1.7% | 2.8% |
| Standard Deviation (Population) | 1.7% | 2.7% |
Demographics Similar to Jamaicans and Yaqui by Ambulatory Disability
In terms of ambulatory disability, the demographic groups most similar to Jamaicans are Celtic (6.7%, a difference of 0.080%), Immigrants from West Indies (6.7%, a difference of 0.080%), Immigrants from Guyana (6.7%, a difference of 0.11%), Sioux (6.7%, a difference of 0.17%), and Immigrants from Caribbean (6.7%, a difference of 0.39%). Similarly, the demographic groups most similar to Yaqui are Pennsylvania German (6.8%, a difference of 0.070%), Barbadian (6.8%, a difference of 0.13%), Immigrants from Caribbean (6.7%, a difference of 0.17%), Immigrants from Barbados (6.8%, a difference of 0.28%), and Immigrants from Jamaica (6.8%, a difference of 0.35%).
| Demographics | Rating | Rank | Ambulatory Disability |
| French | 0.1 /100 | #269 | Tragic 6.6% |
| Slovaks | 0.1 /100 | #270 | Tragic 6.7% |
| Immigrants | Trinidad and Tobago | 0.1 /100 | #271 | Tragic 6.7% |
| French Canadians | 0.1 /100 | #272 | Tragic 6.7% |
| Whites/Caucasians | 0.1 /100 | #273 | Tragic 6.7% |
| Sioux | 0.1 /100 | #274 | Tragic 6.7% |
| Immigrants | Guyana | 0.1 /100 | #275 | Tragic 6.7% |
| Celtics | 0.1 /100 | #276 | Tragic 6.7% |
| Jamaicans | 0.1 /100 | #277 | Tragic 6.7% |
| Immigrants | West Indies | 0.1 /100 | #278 | Tragic 6.7% |
| Immigrants | Caribbean | 0.0 /100 | #279 | Tragic 6.7% |
| Pennsylvania Germans | 0.0 /100 | #280 | Tragic 6.8% |
| Yaqui | 0.0 /100 | #281 | Tragic 6.8% |
| Barbadians | 0.0 /100 | #282 | Tragic 6.8% |
| Immigrants | Barbados | 0.0 /100 | #283 | Tragic 6.8% |
| Immigrants | Jamaica | 0.0 /100 | #284 | Tragic 6.8% |
| Fijians | 0.0 /100 | #285 | Tragic 6.8% |
| Yakama | 0.0 /100 | #286 | Tragic 6.8% |
| U.S. Virgin Islanders | 0.0 /100 | #287 | Tragic 6.8% |
| Immigrants | Nonimmigrants | 0.0 /100 | #288 | Tragic 6.9% |
| Immigrants | Dominica | 0.0 /100 | #289 | Tragic 6.9% |