Jamaican vs Immigrants from Laos Seniors Poverty Over the Age of 65
COMPARE
Jamaican
Immigrants from Laos
Seniors Poverty Over the Age of 65
Seniors Poverty Over the Age of 65 Comparison
Jamaicans
Immigrants from Laos
13.6%
SENIORS POVERTY OVER THE AGE OF 65
0.0/ 100
METRIC RATING
289th/ 347
METRIC RANK
11.1%
SENIORS POVERTY OVER THE AGE OF 65
35.7/ 100
METRIC RATING
189th/ 347
METRIC RANK
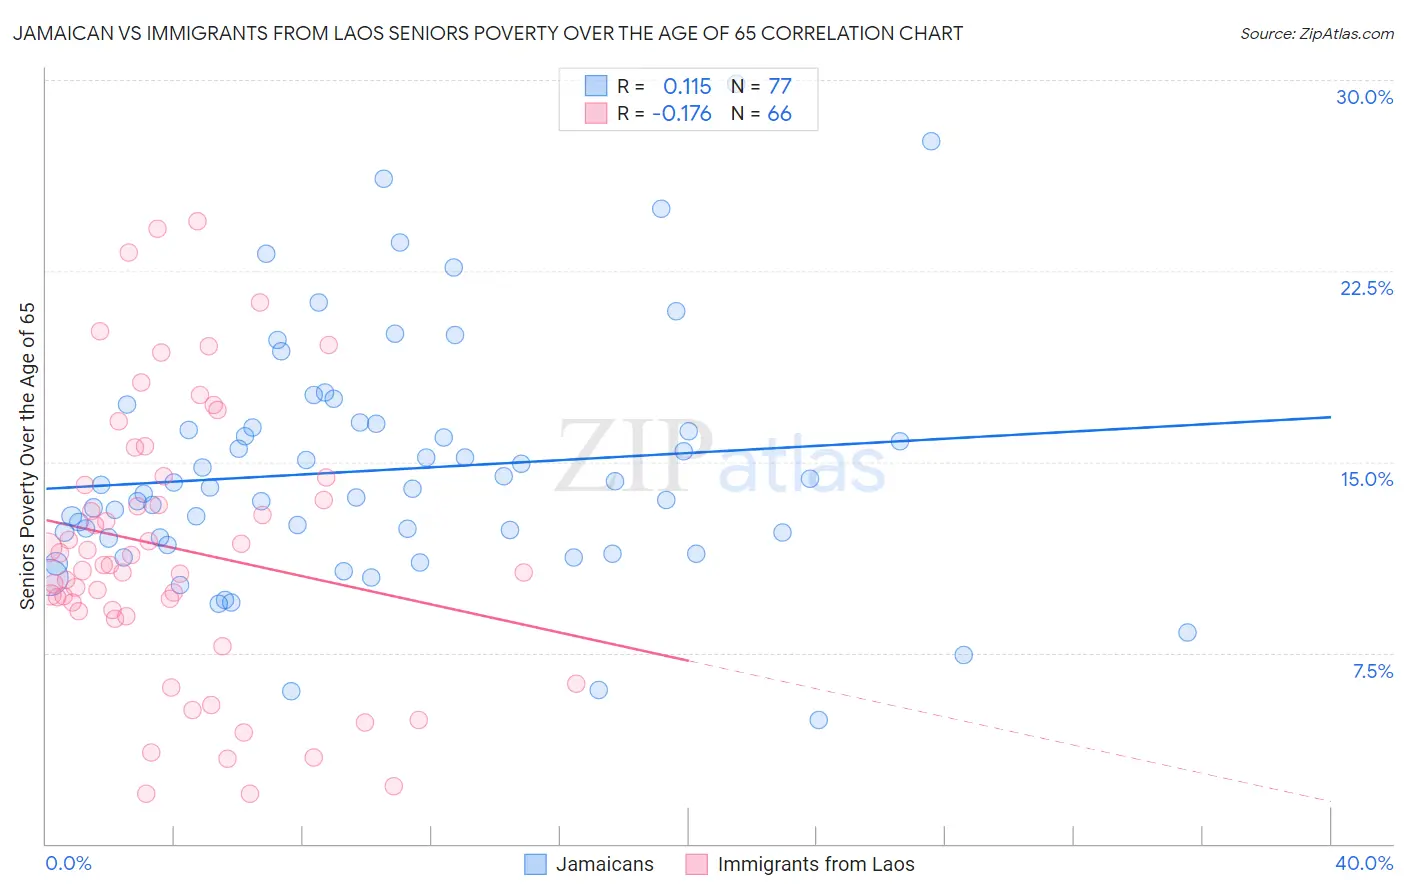
Jamaican vs Immigrants from Laos Seniors Poverty Over the Age of 65 Correlation Chart
The statistical analysis conducted on geographies consisting of 366,396,233 people shows a poor positive correlation between the proportion of Jamaicans and poverty level among seniors over the age of 65 in the United States with a correlation coefficient (R) of 0.115 and weighted average of 13.6%. Similarly, the statistical analysis conducted on geographies consisting of 201,308,841 people shows a poor negative correlation between the proportion of Immigrants from Laos and poverty level among seniors over the age of 65 in the United States with a correlation coefficient (R) of -0.176 and weighted average of 11.1%, a difference of 23.1%.
Seniors Poverty Over the Age of 65 Correlation Summary
| Measurement | Jamaican | Immigrants from Laos |
| Minimum | 4.9% | 2.0% |
| Maximum | 29.8% | 24.5% |
| Range | 25.0% | 22.5% |
| Mean | 14.7% | 11.6% |
| Median | 14.0% | 10.9% |
| Interquartile 25% (IQ1) | 11.9% | 9.1% |
| Interquartile 75% (IQ3) | 16.4% | 14.4% |
| Interquartile Range (IQR) | 4.6% | 5.3% |
| Standard Deviation (Sample) | 4.8% | 5.4% |
| Standard Deviation (Population) | 4.7% | 5.3% |
Similar Demographics by Seniors Poverty Over the Age of 65
Demographics Similar to Jamaicans by Seniors Poverty Over the Age of 65
In terms of seniors poverty over the age of 65, the demographic groups most similar to Jamaicans are Immigrants from Central America (13.6%, a difference of 0.0%), Belizean (13.6%, a difference of 0.27%), Immigrants from Mexico (13.6%, a difference of 0.41%), Black/African American (13.7%, a difference of 0.46%), and Immigrants from Senegal (13.6%, a difference of 0.53%).
| Demographics | Rating | Rank | Seniors Poverty Over the Age of 65 |
| Senegalese | 0.0 /100 | #282 | Tragic 13.3% |
| Central Americans | 0.0 /100 | #283 | Tragic 13.4% |
| Colville | 0.0 /100 | #284 | Tragic 13.5% |
| Guatemalans | 0.0 /100 | #285 | Tragic 13.5% |
| Immigrants | Senegal | 0.0 /100 | #286 | Tragic 13.6% |
| Immigrants | Mexico | 0.0 /100 | #287 | Tragic 13.6% |
| Belizeans | 0.0 /100 | #288 | Tragic 13.6% |
| Jamaicans | 0.0 /100 | #289 | Tragic 13.6% |
| Immigrants | Central America | 0.0 /100 | #290 | Tragic 13.6% |
| Blacks/African Americans | 0.0 /100 | #291 | Tragic 13.7% |
| Spanish American Indians | 0.0 /100 | #292 | Tragic 13.8% |
| Immigrants | Guatemala | 0.0 /100 | #293 | Tragic 13.8% |
| Cheyenne | 0.0 /100 | #294 | Tragic 13.9% |
| Apache | 0.0 /100 | #295 | Tragic 13.9% |
| Immigrants | Jamaica | 0.0 /100 | #296 | Tragic 13.9% |
Demographics Similar to Immigrants from Laos by Seniors Poverty Over the Age of 65
In terms of seniors poverty over the age of 65, the demographic groups most similar to Immigrants from Laos are Immigrants from Hong Kong (11.1%, a difference of 0.060%), Indian (Asian) (11.1%, a difference of 0.15%), Immigrants from Middle Africa (11.1%, a difference of 0.16%), Immigrants from Eastern Asia (11.1%, a difference of 0.17%), and Immigrants from Lebanon (11.1%, a difference of 0.23%).
| Demographics | Rating | Rank | Seniors Poverty Over the Age of 65 |
| Immigrants | Fiji | 42.0 /100 | #182 | Average 11.0% |
| Immigrants | Kazakhstan | 41.0 /100 | #183 | Average 11.0% |
| Immigrants | France | 40.9 /100 | #184 | Average 11.0% |
| Immigrants | Lebanon | 38.2 /100 | #185 | Fair 11.1% |
| Immigrants | Eastern Asia | 37.5 /100 | #186 | Fair 11.1% |
| Immigrants | Middle Africa | 37.4 /100 | #187 | Fair 11.1% |
| Immigrants | Hong Kong | 36.3 /100 | #188 | Fair 11.1% |
| Immigrants | Laos | 35.7 /100 | #189 | Fair 11.1% |
| Indians (Asian) | 34.2 /100 | #190 | Fair 11.1% |
| Immigrants | Uganda | 32.2 /100 | #191 | Fair 11.1% |
| Immigrants | Southern Europe | 30.1 /100 | #192 | Fair 11.1% |
| Taiwanese | 29.2 /100 | #193 | Fair 11.2% |
| Chileans | 27.8 /100 | #194 | Fair 11.2% |
| Immigrants | Vietnam | 26.6 /100 | #195 | Fair 11.2% |
| Bangladeshis | 25.2 /100 | #196 | Fair 11.2% |