Haitian vs Immigrants from Guyana Single Mother Poverty
COMPARE
Haitian
Immigrants from Guyana
Single Mother Poverty
Single Mother Poverty Comparison
Haitians
Immigrants from Guyana
29.8%
SINGLE MOTHER POVERTY
13.3/ 100
METRIC RATING
210th/ 347
METRIC RANK
29.8%
SINGLE MOTHER POVERTY
14.7/ 100
METRIC RATING
208th/ 347
METRIC RANK
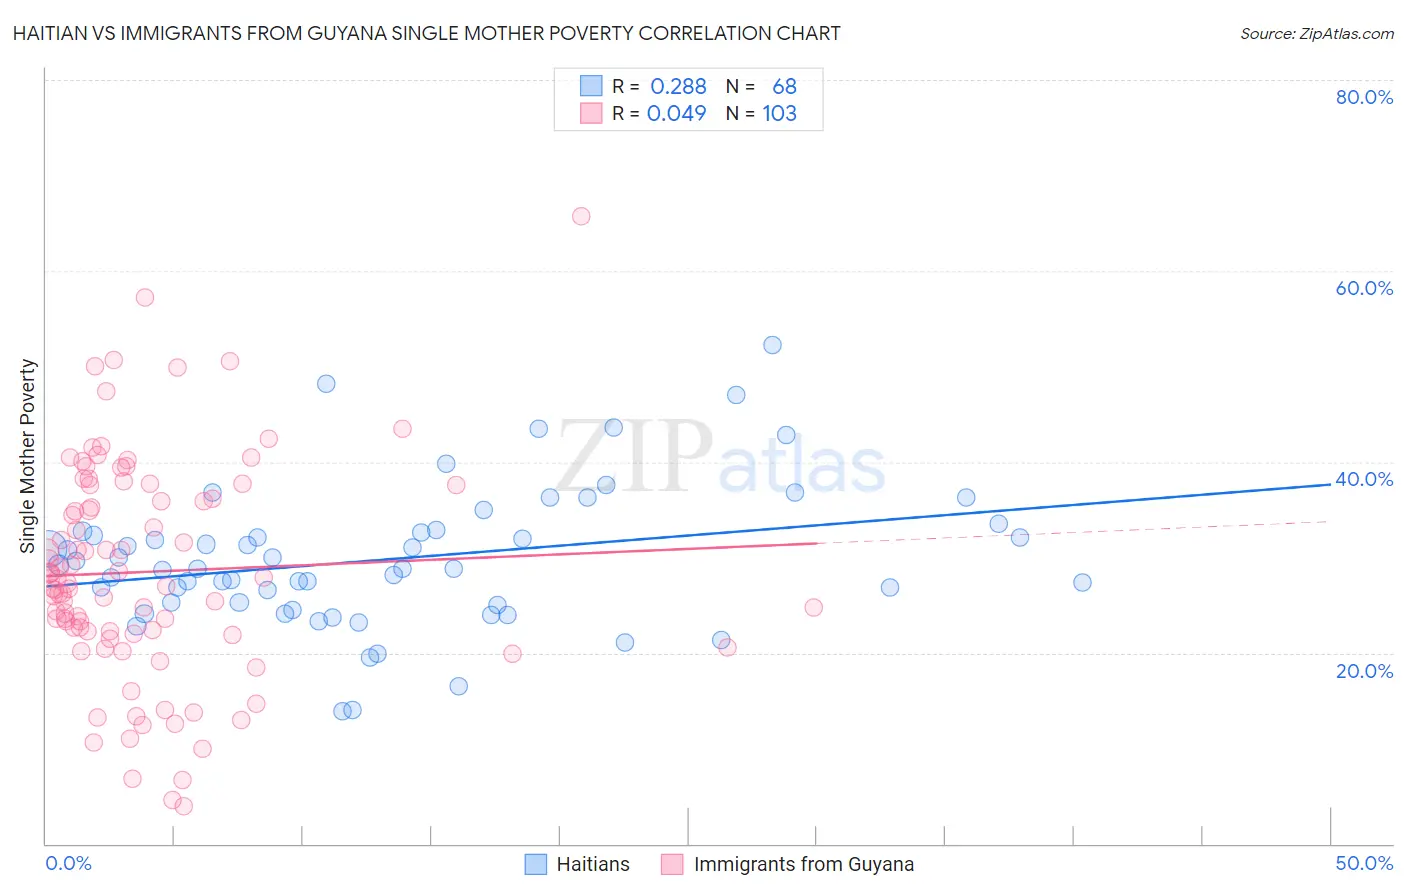
Haitian vs Immigrants from Guyana Single Mother Poverty Correlation Chart
The statistical analysis conducted on geographies consisting of 283,035,153 people shows a weak positive correlation between the proportion of Haitians and poverty level among single mothers in the United States with a correlation coefficient (R) of 0.288 and weighted average of 29.8%. Similarly, the statistical analysis conducted on geographies consisting of 180,945,817 people shows no correlation between the proportion of Immigrants from Guyana and poverty level among single mothers in the United States with a correlation coefficient (R) of 0.049 and weighted average of 29.8%, a difference of 0.14%.
Single Mother Poverty Correlation Summary
| Measurement | Haitian | Immigrants from Guyana |
| Minimum | 13.8% | 4.0% |
| Maximum | 52.2% | 65.7% |
| Range | 38.4% | 61.7% |
| Mean | 29.8% | 28.5% |
| Median | 28.8% | 27.3% |
| Interquartile 25% (IQ1) | 25.1% | 21.9% |
| Interquartile 75% (IQ3) | 32.7% | 37.6% |
| Interquartile Range (IQR) | 7.6% | 15.6% |
| Standard Deviation (Sample) | 7.4% | 11.5% |
| Standard Deviation (Population) | 7.4% | 11.5% |
Demographics Similar to Haitians and Immigrants from Guyana by Single Mother Poverty
In terms of single mother poverty, the demographic groups most similar to Haitians are Guyanese (29.8%, a difference of 0.050%), Irish (29.8%, a difference of 0.060%), Nicaraguan (29.8%, a difference of 0.090%), Immigrants from Thailand (29.9%, a difference of 0.14%), and Liberian (29.9%, a difference of 0.17%). Similarly, the demographic groups most similar to Immigrants from Guyana are Immigrants from Panama (29.8%, a difference of 0.070%), Irish (29.8%, a difference of 0.080%), Immigrants from Haiti (29.7%, a difference of 0.10%), Czechoslovakian (29.7%, a difference of 0.12%), and Immigrants (29.7%, a difference of 0.17%).
| Demographics | Rating | Rank | Single Mother Poverty |
| Cubans | 20.8 /100 | #199 | Fair 29.6% |
| Panamanians | 20.0 /100 | #200 | Fair 29.6% |
| Belgians | 18.8 /100 | #201 | Poor 29.7% |
| Malaysians | 17.4 /100 | #202 | Poor 29.7% |
| Swiss | 17.2 /100 | #203 | Poor 29.7% |
| Immigrants | Immigrants | 16.6 /100 | #204 | Poor 29.7% |
| Czechoslovakians | 16.1 /100 | #205 | Poor 29.7% |
| Immigrants | Haiti | 15.8 /100 | #206 | Poor 29.7% |
| Immigrants | Panama | 15.5 /100 | #207 | Poor 29.8% |
| Immigrants | Guyana | 14.7 /100 | #208 | Poor 29.8% |
| Irish | 13.9 /100 | #209 | Poor 29.8% |
| Haitians | 13.3 /100 | #210 | Poor 29.8% |
| Guyanese | 12.8 /100 | #211 | Poor 29.8% |
| Nicaraguans | 12.4 /100 | #212 | Poor 29.8% |
| Immigrants | Thailand | 12.0 /100 | #213 | Poor 29.9% |
| Liberians | 11.7 /100 | #214 | Poor 29.9% |
| Jamaicans | 11.7 /100 | #215 | Poor 29.9% |
| Immigrants | Western Africa | 11.5 /100 | #216 | Poor 29.9% |
| Immigrants | Ghana | 11.3 /100 | #217 | Poor 29.9% |
| Hungarians | 10.3 /100 | #218 | Poor 29.9% |
| Finns | 9.3 /100 | #219 | Tragic 30.0% |