Jamaican vs Immigrants from Guyana Single Male Poverty
COMPARE
Jamaican
Immigrants from Guyana
Single Male Poverty
Single Male Poverty Comparison
Jamaicans
Immigrants from Guyana
13.2%
SINGLE MALE POVERTY
7.7/ 100
METRIC RATING
226th/ 347
METRIC RANK
12.7%
SINGLE MALE POVERTY
60.5/ 100
METRIC RATING
166th/ 347
METRIC RANK
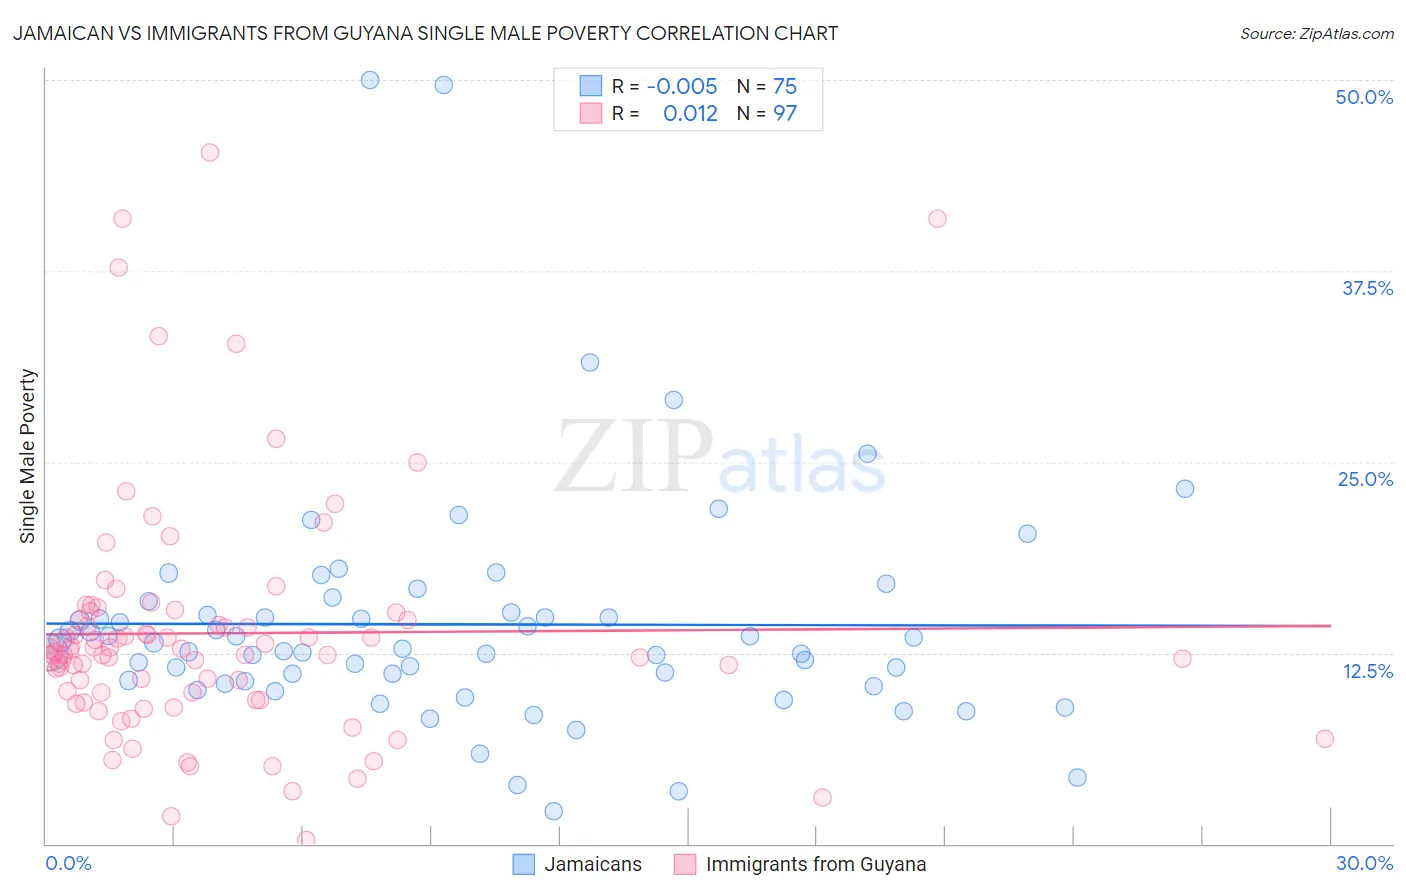
Jamaican vs Immigrants from Guyana Single Male Poverty Correlation Chart
The statistical analysis conducted on geographies consisting of 330,158,708 people shows no correlation between the proportion of Jamaicans and poverty level among single males in the United States with a correlation coefficient (R) of -0.005 and weighted average of 13.2%. Similarly, the statistical analysis conducted on geographies consisting of 169,877,868 people shows no correlation between the proportion of Immigrants from Guyana and poverty level among single males in the United States with a correlation coefficient (R) of 0.012 and weighted average of 12.7%, a difference of 3.8%.
Single Male Poverty Correlation Summary
| Measurement | Jamaican | Immigrants from Guyana |
| Minimum | 2.1% | 0.23% |
| Maximum | 50.0% | 45.3% |
| Range | 47.9% | 45.1% |
| Mean | 14.4% | 13.8% |
| Median | 12.7% | 12.6% |
| Interquartile 25% (IQ1) | 10.6% | 9.7% |
| Interquartile 75% (IQ3) | 15.2% | 14.9% |
| Interquartile Range (IQR) | 4.5% | 5.2% |
| Standard Deviation (Sample) | 7.8% | 7.9% |
| Standard Deviation (Population) | 7.8% | 7.9% |
Similar Demographics by Single Male Poverty
Demographics Similar to Jamaicans by Single Male Poverty
In terms of single male poverty, the demographic groups most similar to Jamaicans are Haitian (13.2%, a difference of 0.13%), Immigrants from Denmark (13.2%, a difference of 0.16%), Lebanese (13.2%, a difference of 0.21%), Somali (13.2%, a difference of 0.22%), and Immigrants from the Azores (13.2%, a difference of 0.25%).
| Demographics | Rating | Rank | Single Male Poverty |
| Immigrants | Burma/Myanmar | 12.6 /100 | #219 | Poor 13.1% |
| Central Americans | 10.9 /100 | #220 | Poor 13.2% |
| New Zealanders | 10.7 /100 | #221 | Poor 13.2% |
| Immigrants | Western Europe | 10.0 /100 | #222 | Poor 13.2% |
| Immigrants | Azores | 9.3 /100 | #223 | Tragic 13.2% |
| Somalis | 9.1 /100 | #224 | Tragic 13.2% |
| Immigrants | Denmark | 8.7 /100 | #225 | Tragic 13.2% |
| Jamaicans | 7.7 /100 | #226 | Tragic 13.2% |
| Haitians | 7.0 /100 | #227 | Tragic 13.2% |
| Lebanese | 6.6 /100 | #228 | Tragic 13.2% |
| Europeans | 6.2 /100 | #229 | Tragic 13.3% |
| Ghanaians | 6.1 /100 | #230 | Tragic 13.3% |
| Slavs | 5.3 /100 | #231 | Tragic 13.3% |
| Immigrants | Caribbean | 5.0 /100 | #232 | Tragic 13.3% |
| British | 4.0 /100 | #233 | Tragic 13.3% |
Demographics Similar to Immigrants from Guyana by Single Male Poverty
In terms of single male poverty, the demographic groups most similar to Immigrants from Guyana are Immigrants from Cambodia (12.7%, a difference of 0.090%), Immigrants from Nigeria (12.7%, a difference of 0.13%), Immigrants from Sudan (12.7%, a difference of 0.13%), Palestinian (12.7%, a difference of 0.14%), and Immigrants from Barbados (12.7%, a difference of 0.15%).
| Demographics | Rating | Rank | Single Male Poverty |
| Immigrants | Liberia | 64.2 /100 | #159 | Good 12.7% |
| Greeks | 64.1 /100 | #160 | Good 12.7% |
| Immigrants | Africa | 63.4 /100 | #161 | Good 12.7% |
| Eastern Europeans | 63.3 /100 | #162 | Good 12.7% |
| Palestinians | 63.1 /100 | #163 | Good 12.7% |
| Immigrants | Nigeria | 62.8 /100 | #164 | Good 12.7% |
| Immigrants | Cambodia | 62.2 /100 | #165 | Good 12.7% |
| Immigrants | Guyana | 60.5 /100 | #166 | Good 12.7% |
| Immigrants | Sudan | 58.2 /100 | #167 | Average 12.7% |
| Immigrants | Barbados | 57.7 /100 | #168 | Average 12.7% |
| Puget Sound Salish | 54.3 /100 | #169 | Average 12.8% |
| Guyanese | 52.0 /100 | #170 | Average 12.8% |
| South Africans | 51.5 /100 | #171 | Average 12.8% |
| Danes | 51.4 /100 | #172 | Average 12.8% |
| Immigrants | St. Vincent and the Grenadines | 50.9 /100 | #173 | Average 12.8% |