British West Indian vs Immigrants from Guyana Single Mother Poverty
COMPARE
British West Indian
Immigrants from Guyana
Single Mother Poverty
Single Mother Poverty Comparison
British West Indians
Immigrants from Guyana
31.5%
SINGLE MOTHER POVERTY
0.1/ 100
METRIC RATING
270th/ 347
METRIC RANK
29.8%
SINGLE MOTHER POVERTY
14.7/ 100
METRIC RATING
208th/ 347
METRIC RANK
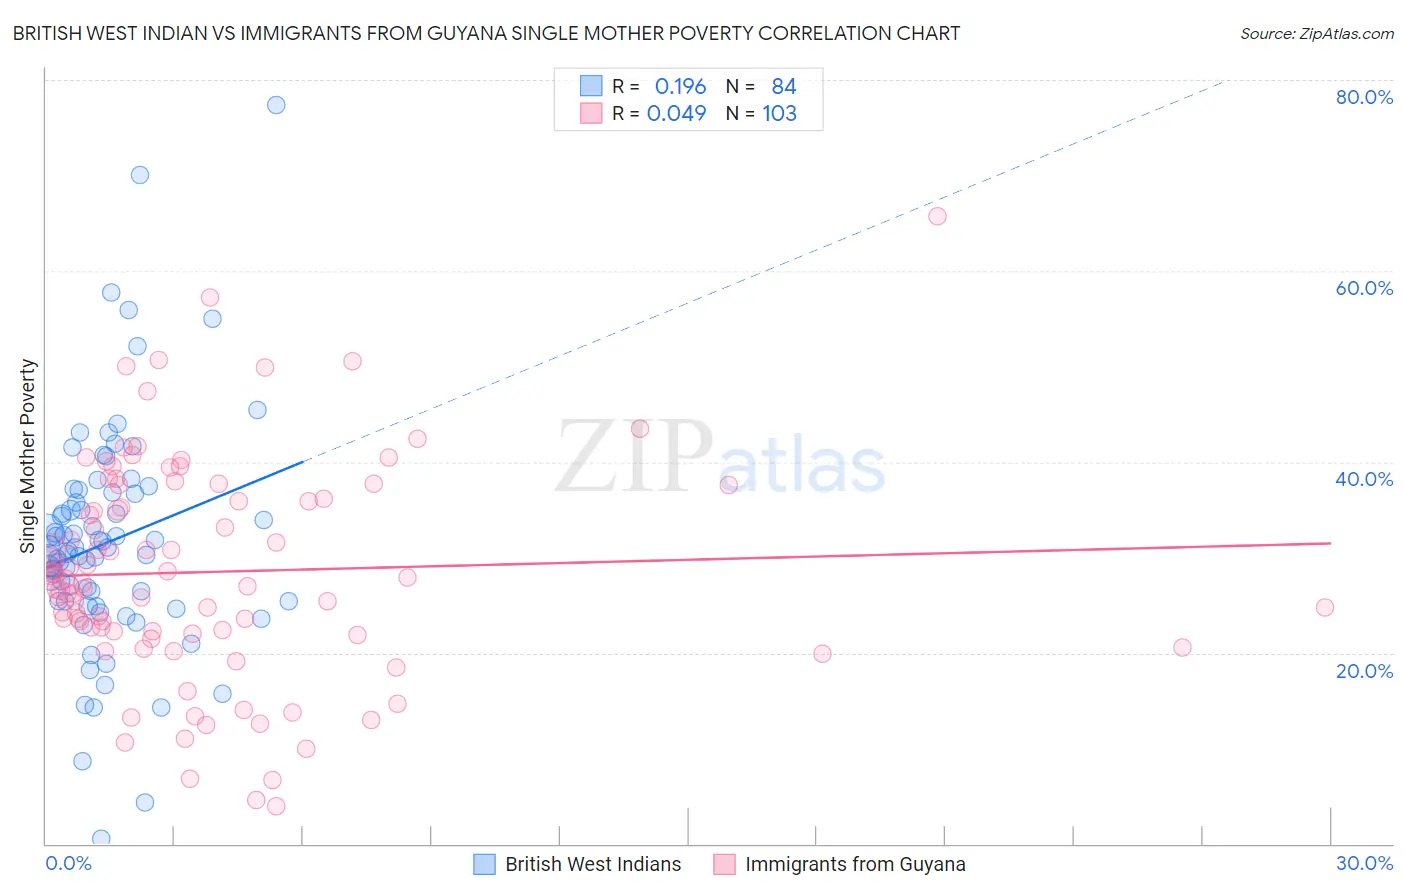
British West Indian vs Immigrants from Guyana Single Mother Poverty Correlation Chart
The statistical analysis conducted on geographies consisting of 151,437,686 people shows a poor positive correlation between the proportion of British West Indians and poverty level among single mothers in the United States with a correlation coefficient (R) of 0.196 and weighted average of 31.5%. Similarly, the statistical analysis conducted on geographies consisting of 180,945,817 people shows no correlation between the proportion of Immigrants from Guyana and poverty level among single mothers in the United States with a correlation coefficient (R) of 0.049 and weighted average of 29.8%, a difference of 5.8%.
Single Mother Poverty Correlation Summary
| Measurement | British West Indian | Immigrants from Guyana |
| Minimum | 0.48% | 4.0% |
| Maximum | 77.3% | 65.7% |
| Range | 76.9% | 61.7% |
| Mean | 31.6% | 28.5% |
| Median | 30.9% | 27.3% |
| Interquartile 25% (IQ1) | 25.4% | 21.9% |
| Interquartile 75% (IQ3) | 36.7% | 37.6% |
| Interquartile Range (IQR) | 11.3% | 15.6% |
| Standard Deviation (Sample) | 12.1% | 11.5% |
| Standard Deviation (Population) | 12.0% | 11.5% |
Similar Demographics by Single Mother Poverty
Demographics Similar to British West Indians by Single Mother Poverty
In terms of single mother poverty, the demographic groups most similar to British West Indians are Scotch-Irish (31.5%, a difference of 0.050%), Immigrants from Senegal (31.5%, a difference of 0.090%), Immigrants from Cabo Verde (31.6%, a difference of 0.24%), Immigrants from Micronesia (31.6%, a difference of 0.26%), and Immigrants from Belize (31.4%, a difference of 0.27%).
| Demographics | Rating | Rank | Single Mother Poverty |
| Bahamians | 0.2 /100 | #263 | Tragic 31.3% |
| Immigrants | Ecuador | 0.2 /100 | #264 | Tragic 31.3% |
| German Russians | 0.2 /100 | #265 | Tragic 31.3% |
| Sub-Saharan Africans | 0.2 /100 | #266 | Tragic 31.4% |
| Immigrants | Belize | 0.2 /100 | #267 | Tragic 31.4% |
| Immigrants | Senegal | 0.1 /100 | #268 | Tragic 31.5% |
| Scotch-Irish | 0.1 /100 | #269 | Tragic 31.5% |
| British West Indians | 0.1 /100 | #270 | Tragic 31.5% |
| Immigrants | Cabo Verde | 0.1 /100 | #271 | Tragic 31.6% |
| Immigrants | Micronesia | 0.1 /100 | #272 | Tragic 31.6% |
| Fijians | 0.1 /100 | #273 | Tragic 31.6% |
| Bangladeshis | 0.1 /100 | #274 | Tragic 31.7% |
| Central Americans | 0.1 /100 | #275 | Tragic 31.8% |
| Delaware | 0.0 /100 | #276 | Tragic 31.8% |
| Mexican American Indians | 0.0 /100 | #277 | Tragic 31.9% |
Demographics Similar to Immigrants from Guyana by Single Mother Poverty
In terms of single mother poverty, the demographic groups most similar to Immigrants from Guyana are Immigrants from Panama (29.8%, a difference of 0.070%), Irish (29.8%, a difference of 0.080%), Immigrants from Haiti (29.7%, a difference of 0.10%), Czechoslovakian (29.7%, a difference of 0.12%), and Haitian (29.8%, a difference of 0.14%).
| Demographics | Rating | Rank | Single Mother Poverty |
| Belgians | 18.8 /100 | #201 | Poor 29.7% |
| Malaysians | 17.4 /100 | #202 | Poor 29.7% |
| Swiss | 17.2 /100 | #203 | Poor 29.7% |
| Immigrants | Immigrants | 16.6 /100 | #204 | Poor 29.7% |
| Czechoslovakians | 16.1 /100 | #205 | Poor 29.7% |
| Immigrants | Haiti | 15.8 /100 | #206 | Poor 29.7% |
| Immigrants | Panama | 15.5 /100 | #207 | Poor 29.8% |
| Immigrants | Guyana | 14.7 /100 | #208 | Poor 29.8% |
| Irish | 13.9 /100 | #209 | Poor 29.8% |
| Haitians | 13.3 /100 | #210 | Poor 29.8% |
| Guyanese | 12.8 /100 | #211 | Poor 29.8% |
| Nicaraguans | 12.4 /100 | #212 | Poor 29.8% |
| Immigrants | Thailand | 12.0 /100 | #213 | Poor 29.9% |
| Liberians | 11.7 /100 | #214 | Poor 29.9% |
| Jamaicans | 11.7 /100 | #215 | Poor 29.9% |