Iroquois vs Immigrants from Guyana Single Mother Poverty
COMPARE
Iroquois
Immigrants from Guyana
Single Mother Poverty
Single Mother Poverty Comparison
Iroquois
Immigrants from Guyana
34.8%
SINGLE MOTHER POVERTY
0.0/ 100
METRIC RATING
320th/ 347
METRIC RANK
29.8%
SINGLE MOTHER POVERTY
14.7/ 100
METRIC RATING
208th/ 347
METRIC RANK
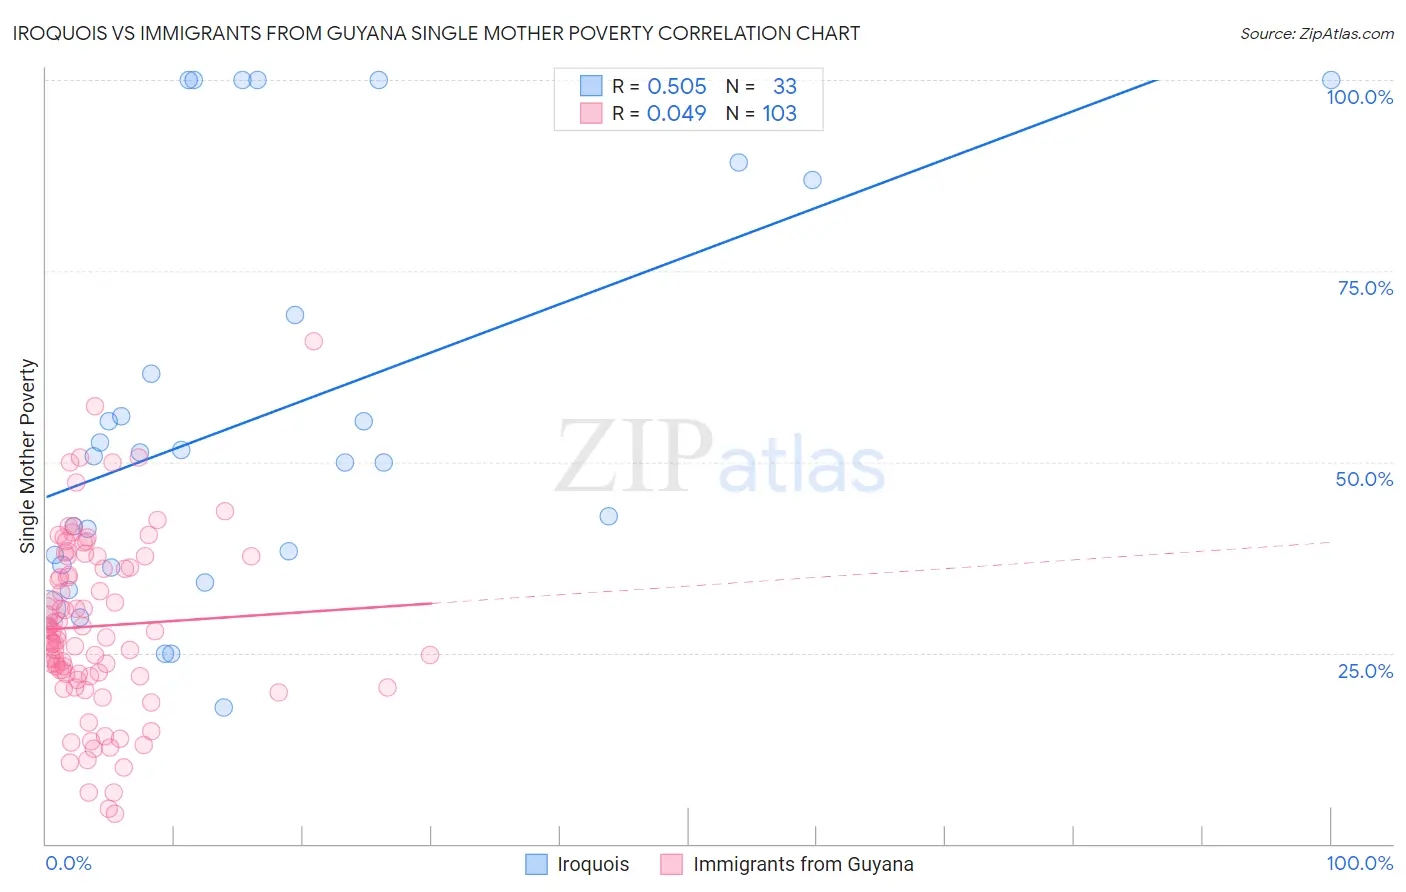
Iroquois vs Immigrants from Guyana Single Mother Poverty Correlation Chart
The statistical analysis conducted on geographies consisting of 204,844,819 people shows a substantial positive correlation between the proportion of Iroquois and poverty level among single mothers in the United States with a correlation coefficient (R) of 0.505 and weighted average of 34.8%. Similarly, the statistical analysis conducted on geographies consisting of 180,945,817 people shows no correlation between the proportion of Immigrants from Guyana and poverty level among single mothers in the United States with a correlation coefficient (R) of 0.049 and weighted average of 29.8%, a difference of 17.0%.
Single Mother Poverty Correlation Summary
| Measurement | Iroquois | Immigrants from Guyana |
| Minimum | 17.9% | 4.0% |
| Maximum | 100.0% | 65.7% |
| Range | 82.1% | 61.7% |
| Mean | 56.0% | 28.5% |
| Median | 50.8% | 27.3% |
| Interquartile 25% (IQ1) | 36.4% | 21.9% |
| Interquartile 75% (IQ3) | 78.1% | 37.6% |
| Interquartile Range (IQR) | 41.7% | 15.6% |
| Standard Deviation (Sample) | 26.1% | 11.5% |
| Standard Deviation (Population) | 25.7% | 11.5% |
Similar Demographics by Single Mother Poverty
Demographics Similar to Iroquois by Single Mother Poverty
In terms of single mother poverty, the demographic groups most similar to Iroquois are Chippewa (34.8%, a difference of 0.24%), Immigrants from Honduras (34.7%, a difference of 0.39%), Paiute (35.1%, a difference of 0.87%), Cherokee (34.5%, a difference of 0.91%), and Dominican (34.5%, a difference of 1.0%).
| Demographics | Rating | Rank | Single Mother Poverty |
| Immigrants | Dominican Republic | 0.0 /100 | #313 | Tragic 34.4% |
| Chickasaw | 0.0 /100 | #314 | Tragic 34.4% |
| Hopi | 0.0 /100 | #315 | Tragic 34.5% |
| Dominicans | 0.0 /100 | #316 | Tragic 34.5% |
| Cherokee | 0.0 /100 | #317 | Tragic 34.5% |
| Immigrants | Honduras | 0.0 /100 | #318 | Tragic 34.7% |
| Chippewa | 0.0 /100 | #319 | Tragic 34.8% |
| Iroquois | 0.0 /100 | #320 | Tragic 34.8% |
| Paiute | 0.0 /100 | #321 | Tragic 35.1% |
| Blacks/African Americans | 0.0 /100 | #322 | Tragic 35.2% |
| Kiowa | 0.0 /100 | #323 | Tragic 35.5% |
| Ottawa | 0.0 /100 | #324 | Tragic 35.5% |
| Ute | 0.0 /100 | #325 | Tragic 35.7% |
| Seminole | 0.0 /100 | #326 | Tragic 35.8% |
| Yakama | 0.0 /100 | #327 | Tragic 36.4% |
Demographics Similar to Immigrants from Guyana by Single Mother Poverty
In terms of single mother poverty, the demographic groups most similar to Immigrants from Guyana are Immigrants from Panama (29.8%, a difference of 0.070%), Irish (29.8%, a difference of 0.080%), Immigrants from Haiti (29.7%, a difference of 0.10%), Czechoslovakian (29.7%, a difference of 0.12%), and Haitian (29.8%, a difference of 0.14%).
| Demographics | Rating | Rank | Single Mother Poverty |
| Belgians | 18.8 /100 | #201 | Poor 29.7% |
| Malaysians | 17.4 /100 | #202 | Poor 29.7% |
| Swiss | 17.2 /100 | #203 | Poor 29.7% |
| Immigrants | Immigrants | 16.6 /100 | #204 | Poor 29.7% |
| Czechoslovakians | 16.1 /100 | #205 | Poor 29.7% |
| Immigrants | Haiti | 15.8 /100 | #206 | Poor 29.7% |
| Immigrants | Panama | 15.5 /100 | #207 | Poor 29.8% |
| Immigrants | Guyana | 14.7 /100 | #208 | Poor 29.8% |
| Irish | 13.9 /100 | #209 | Poor 29.8% |
| Haitians | 13.3 /100 | #210 | Poor 29.8% |
| Guyanese | 12.8 /100 | #211 | Poor 29.8% |
| Nicaraguans | 12.4 /100 | #212 | Poor 29.8% |
| Immigrants | Thailand | 12.0 /100 | #213 | Poor 29.9% |
| Liberians | 11.7 /100 | #214 | Poor 29.9% |
| Jamaicans | 11.7 /100 | #215 | Poor 29.9% |