Bangladeshi vs Immigrants from Bolivia Poverty
COMPARE
Bangladeshi
Immigrants from Bolivia
Poverty
Poverty Comparison
Bangladeshis
Immigrants from Bolivia
14.8%
POVERTY
0.0/ 100
METRIC RATING
277th/ 347
METRIC RANK
10.4%
POVERTY
99.8/ 100
METRIC RATING
14th/ 347
METRIC RANK
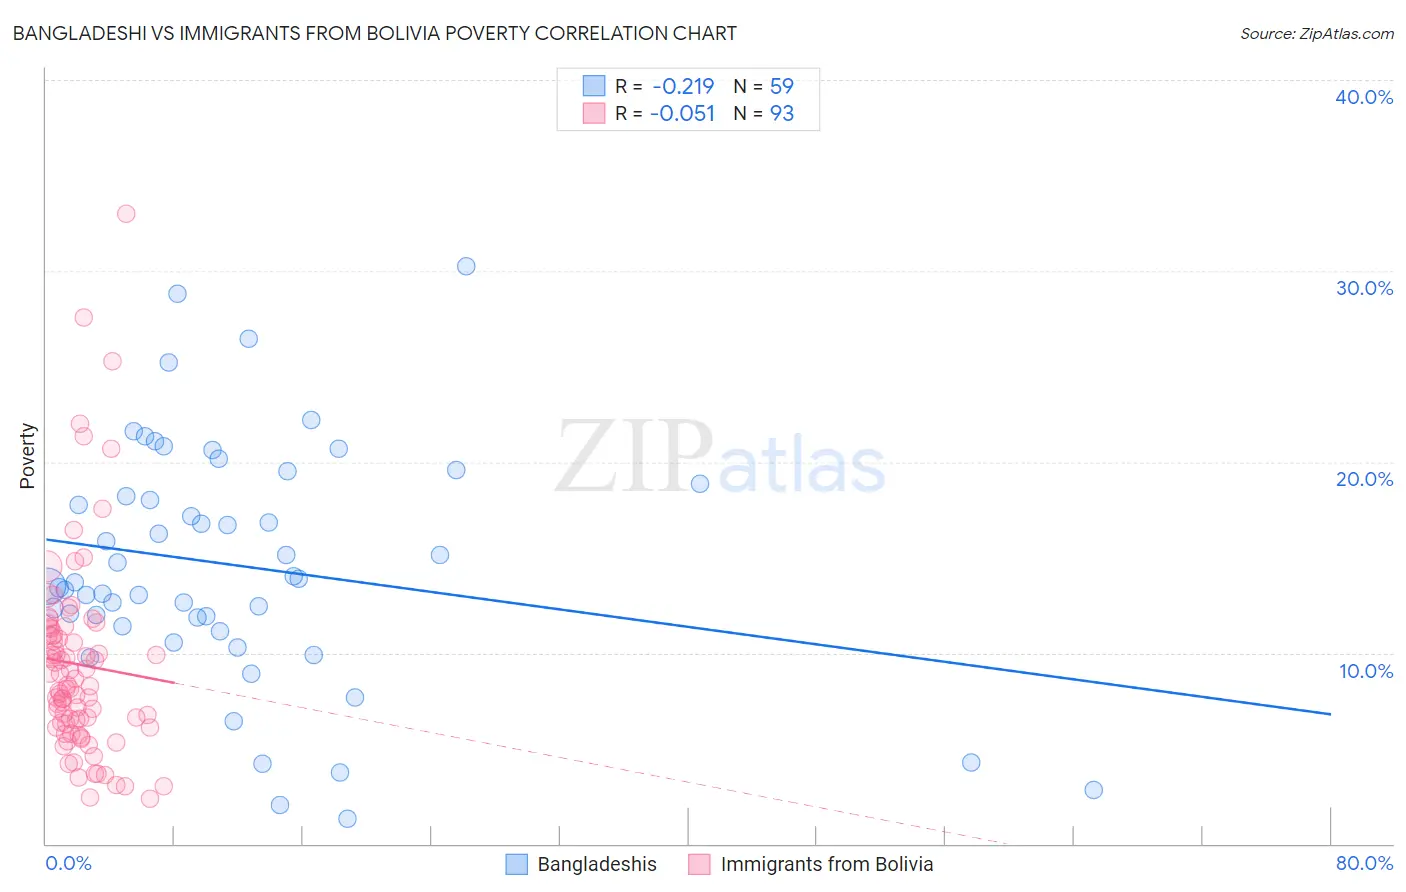
Bangladeshi vs Immigrants from Bolivia Poverty Correlation Chart
The statistical analysis conducted on geographies consisting of 141,359,209 people shows a weak negative correlation between the proportion of Bangladeshis and poverty level in the United States with a correlation coefficient (R) of -0.219 and weighted average of 14.8%. Similarly, the statistical analysis conducted on geographies consisting of 158,712,653 people shows a slight negative correlation between the proportion of Immigrants from Bolivia and poverty level in the United States with a correlation coefficient (R) of -0.051 and weighted average of 10.4%, a difference of 41.9%.
Poverty Correlation Summary
| Measurement | Bangladeshi | Immigrants from Bolivia |
| Minimum | 1.3% | 2.3% |
| Maximum | 30.2% | 33.0% |
| Range | 28.9% | 30.6% |
| Mean | 14.6% | 9.4% |
| Median | 13.7% | 8.2% |
| Interquartile 25% (IQ1) | 11.4% | 6.2% |
| Interquartile 75% (IQ3) | 18.9% | 11.1% |
| Interquartile Range (IQR) | 7.5% | 4.9% |
| Standard Deviation (Sample) | 6.3% | 5.3% |
| Standard Deviation (Population) | 6.2% | 5.3% |
Similar Demographics by Poverty
Demographics Similar to Bangladeshis by Poverty
In terms of poverty, the demographic groups most similar to Bangladeshis are Belizean (14.8%, a difference of 0.020%), Immigrants from Bahamas (14.8%, a difference of 0.050%), Immigrants from West Indies (14.8%, a difference of 0.060%), Barbadian (14.8%, a difference of 0.090%), and Immigrants from St. Vincent and the Grenadines (14.9%, a difference of 0.31%).
| Demographics | Rating | Rank | Poverty |
| Central Americans | 0.1 /100 | #270 | Tragic 14.6% |
| Shoshone | 0.0 /100 | #271 | Tragic 14.7% |
| Chickasaw | 0.0 /100 | #272 | Tragic 14.7% |
| Spanish Americans | 0.0 /100 | #273 | Tragic 14.7% |
| Barbadians | 0.0 /100 | #274 | Tragic 14.8% |
| Immigrants | West Indies | 0.0 /100 | #275 | Tragic 14.8% |
| Immigrants | Bahamas | 0.0 /100 | #276 | Tragic 14.8% |
| Bangladeshis | 0.0 /100 | #277 | Tragic 14.8% |
| Belizeans | 0.0 /100 | #278 | Tragic 14.8% |
| Immigrants | St. Vincent and the Grenadines | 0.0 /100 | #279 | Tragic 14.9% |
| Haitians | 0.0 /100 | #280 | Tragic 14.9% |
| Immigrants | Barbados | 0.0 /100 | #281 | Tragic 14.9% |
| Comanche | 0.0 /100 | #282 | Tragic 15.0% |
| Immigrants | Haiti | 0.0 /100 | #283 | Tragic 15.0% |
| West Indians | 0.0 /100 | #284 | Tragic 15.0% |
Demographics Similar to Immigrants from Bolivia by Poverty
In terms of poverty, the demographic groups most similar to Immigrants from Bolivia are Bolivian (10.4%, a difference of 0.010%), Immigrants from Hong Kong (10.4%, a difference of 0.31%), Lithuanian (10.5%, a difference of 0.31%), Bhutanese (10.4%, a difference of 0.53%), and Norwegian (10.5%, a difference of 0.68%).
| Demographics | Rating | Rank | Poverty |
| Filipinos | 99.9 /100 | #7 | Exceptional 10.1% |
| Maltese | 99.9 /100 | #8 | Exceptional 10.2% |
| Immigrants | South Central Asia | 99.9 /100 | #9 | Exceptional 10.2% |
| Bulgarians | 99.9 /100 | #10 | Exceptional 10.2% |
| Immigrants | Lithuania | 99.9 /100 | #11 | Exceptional 10.3% |
| Bhutanese | 99.8 /100 | #12 | Exceptional 10.4% |
| Immigrants | Hong Kong | 99.8 /100 | #13 | Exceptional 10.4% |
| Immigrants | Bolivia | 99.8 /100 | #14 | Exceptional 10.4% |
| Bolivians | 99.8 /100 | #15 | Exceptional 10.4% |
| Lithuanians | 99.8 /100 | #16 | Exceptional 10.5% |
| Norwegians | 99.8 /100 | #17 | Exceptional 10.5% |
| Latvians | 99.8 /100 | #18 | Exceptional 10.5% |
| Immigrants | Scotland | 99.7 /100 | #19 | Exceptional 10.6% |
| Immigrants | North Macedonia | 99.7 /100 | #20 | Exceptional 10.6% |
| Luxembourgers | 99.7 /100 | #21 | Exceptional 10.6% |