British vs Immigrants from Africa Single Father Poverty
COMPARE
British
Immigrants from Africa
Single Father Poverty
Single Father Poverty Comparison
British
Immigrants from Africa
16.8%
SINGLE FATHER POVERTY
5.6/ 100
METRIC RATING
227th/ 347
METRIC RANK
15.8%
SINGLE FATHER POVERTY
95.1/ 100
METRIC RATING
110th/ 347
METRIC RANK
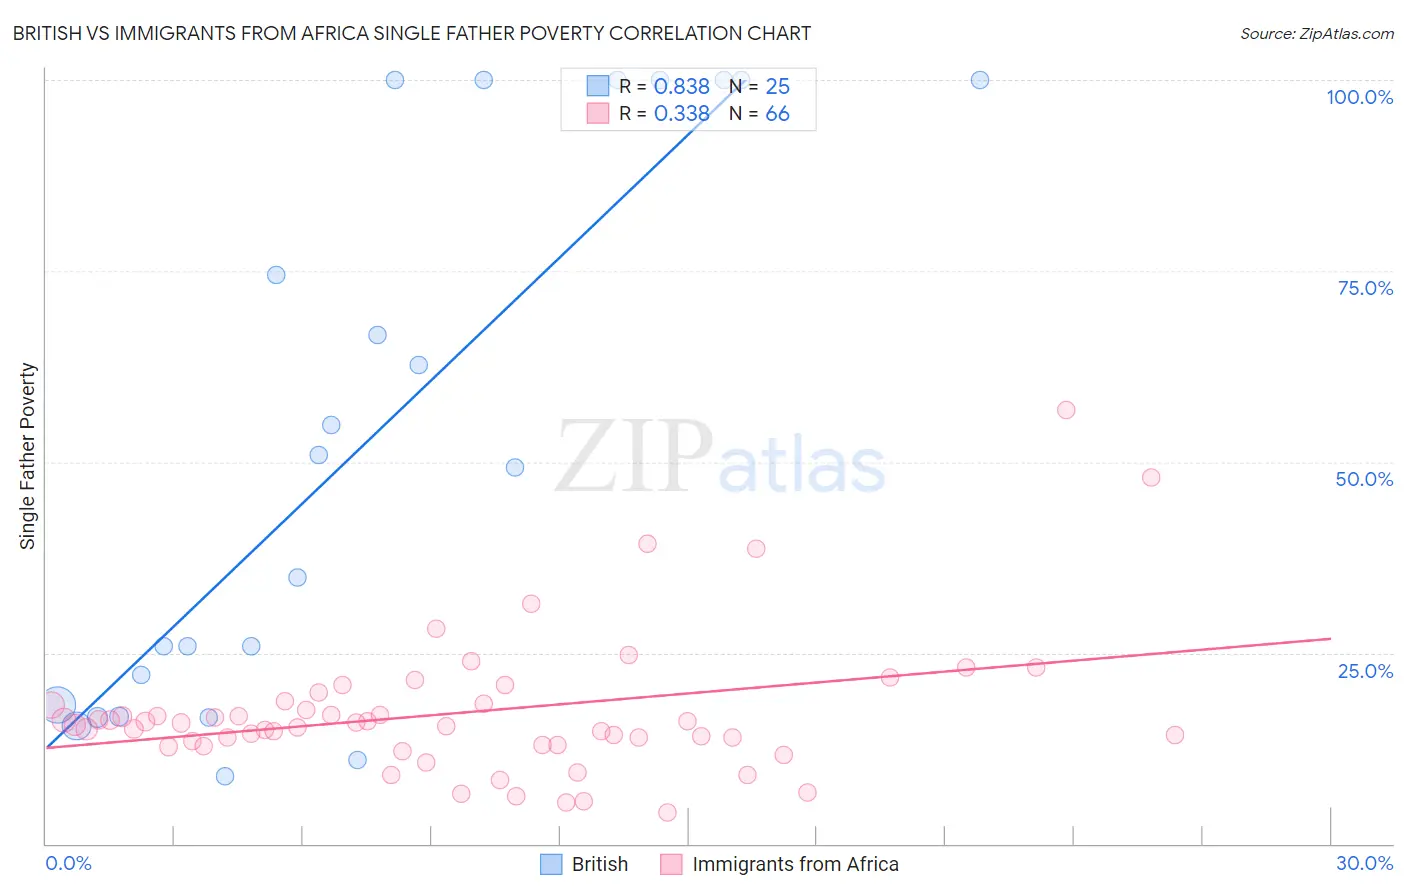
British vs Immigrants from Africa Single Father Poverty Correlation Chart
The statistical analysis conducted on geographies consisting of 389,691,429 people shows a very strong positive correlation between the proportion of British and poverty level among single fathers in the United States with a correlation coefficient (R) of 0.838 and weighted average of 16.8%. Similarly, the statistical analysis conducted on geographies consisting of 360,154,757 people shows a mild positive correlation between the proportion of Immigrants from Africa and poverty level among single fathers in the United States with a correlation coefficient (R) of 0.338 and weighted average of 15.8%, a difference of 6.6%.
Single Father Poverty Correlation Summary
| Measurement | British | Immigrants from Africa |
| Minimum | 8.8% | 4.1% |
| Maximum | 100.0% | 56.8% |
| Range | 91.2% | 52.7% |
| Mean | 51.9% | 17.1% |
| Median | 49.3% | 15.7% |
| Interquartile 25% (IQ1) | 17.4% | 13.0% |
| Interquartile 75% (IQ3) | 100.0% | 18.3% |
| Interquartile Range (IQR) | 82.6% | 5.3% |
| Standard Deviation (Sample) | 35.4% | 9.1% |
| Standard Deviation (Population) | 34.6% | 9.0% |
Similar Demographics by Single Father Poverty
Demographics Similar to British by Single Father Poverty
In terms of single father poverty, the demographic groups most similar to British are Belgian (16.8%, a difference of 0.070%), Hispanic or Latino (16.8%, a difference of 0.10%), Menominee (16.8%, a difference of 0.15%), Immigrants from Norway (16.8%, a difference of 0.16%), and Israeli (16.8%, a difference of 0.22%).
| Demographics | Rating | Rank | Single Father Poverty |
| Immigrants | Denmark | 8.1 /100 | #220 | Tragic 16.7% |
| Immigrants | Greece | 8.1 /100 | #221 | Tragic 16.7% |
| Immigrants | Spain | 8.0 /100 | #222 | Tragic 16.7% |
| Immigrants | Austria | 7.0 /100 | #223 | Tragic 16.8% |
| Immigrants | Norway | 6.5 /100 | #224 | Tragic 16.8% |
| Menominee | 6.4 /100 | #225 | Tragic 16.8% |
| Hispanics or Latinos | 6.1 /100 | #226 | Tragic 16.8% |
| British | 5.6 /100 | #227 | Tragic 16.8% |
| Belgians | 5.3 /100 | #228 | Tragic 16.8% |
| Israelis | 4.6 /100 | #229 | Tragic 16.8% |
| Immigrants | Trinidad and Tobago | 4.5 /100 | #230 | Tragic 16.8% |
| Spanish Americans | 3.7 /100 | #231 | Tragic 16.9% |
| Immigrants | Grenada | 3.7 /100 | #232 | Tragic 16.9% |
| Senegalese | 3.2 /100 | #233 | Tragic 16.9% |
| Marshallese | 3.1 /100 | #234 | Tragic 16.9% |
Demographics Similar to Immigrants from Africa by Single Father Poverty
In terms of single father poverty, the demographic groups most similar to Immigrants from Africa are Turkish (15.8%, a difference of 0.010%), Bulgarian (15.8%, a difference of 0.050%), Immigrants from Latvia (15.8%, a difference of 0.080%), Danish (15.8%, a difference of 0.13%), and Argentinean (15.8%, a difference of 0.14%).
| Demographics | Rating | Rank | Single Father Poverty |
| South American Indians | 96.2 /100 | #103 | Exceptional 15.7% |
| Australians | 96.1 /100 | #104 | Exceptional 15.7% |
| Immigrants | Australia | 96.1 /100 | #105 | Exceptional 15.7% |
| Immigrants | Poland | 95.8 /100 | #106 | Exceptional 15.7% |
| Native Hawaiians | 95.8 /100 | #107 | Exceptional 15.7% |
| Pakistanis | 95.7 /100 | #108 | Exceptional 15.7% |
| Turks | 95.1 /100 | #109 | Exceptional 15.8% |
| Immigrants | Africa | 95.1 /100 | #110 | Exceptional 15.8% |
| Bulgarians | 94.8 /100 | #111 | Exceptional 15.8% |
| Immigrants | Latvia | 94.7 /100 | #112 | Exceptional 15.8% |
| Danes | 94.5 /100 | #113 | Exceptional 15.8% |
| Argentineans | 94.4 /100 | #114 | Exceptional 15.8% |
| Immigrants | Thailand | 93.6 /100 | #115 | Exceptional 15.8% |
| Immigrants | Argentina | 92.8 /100 | #116 | Exceptional 15.8% |
| Immigrants | Colombia | 92.6 /100 | #117 | Exceptional 15.8% |