Ute vs Cheyenne Single Mother Poverty
COMPARE
Ute
Cheyenne
Single Mother Poverty
Single Mother Poverty Comparison
Ute
Cheyenne
35.7%
SINGLE MOTHER POVERTY
0.0/ 100
METRIC RATING
325th/ 347
METRIC RANK
38.5%
SINGLE MOTHER POVERTY
0.0/ 100
METRIC RATING
336th/ 347
METRIC RANK
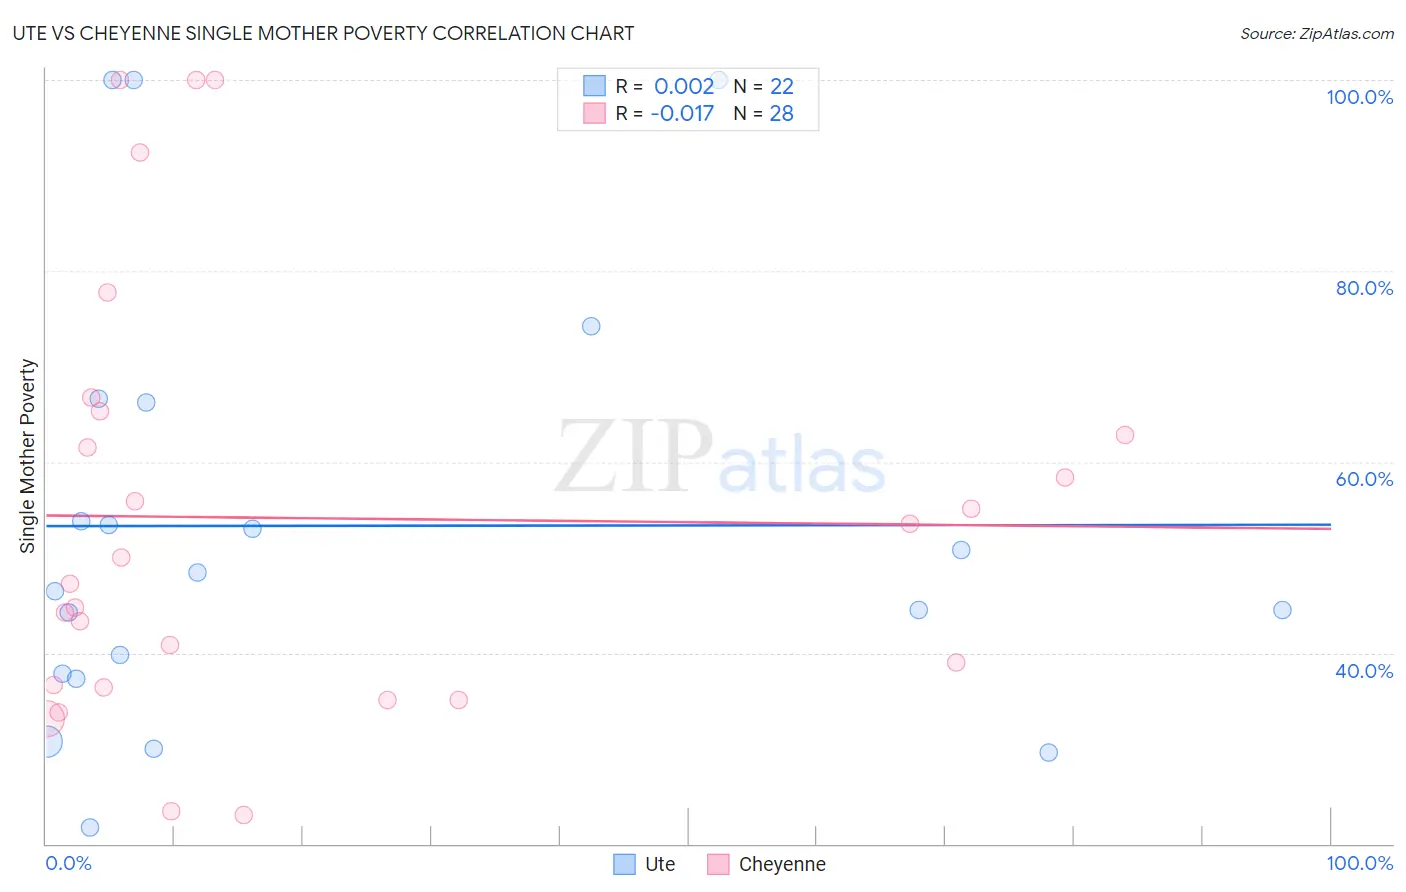
Ute vs Cheyenne Single Mother Poverty Correlation Chart
The statistical analysis conducted on geographies consisting of 55,474,720 people shows no correlation between the proportion of Ute and poverty level among single mothers in the United States with a correlation coefficient (R) of 0.002 and weighted average of 35.7%. Similarly, the statistical analysis conducted on geographies consisting of 80,348,704 people shows no correlation between the proportion of Cheyenne and poverty level among single mothers in the United States with a correlation coefficient (R) of -0.017 and weighted average of 38.5%, a difference of 7.8%.
Single Mother Poverty Correlation Summary
| Measurement | Ute | Cheyenne |
| Minimum | 21.7% | 23.1% |
| Maximum | 100.0% | 100.0% |
| Range | 78.3% | 76.9% |
| Mean | 53.3% | 54.1% |
| Median | 47.4% | 48.6% |
| Interquartile 25% (IQ1) | 37.9% | 36.5% |
| Interquartile 75% (IQ3) | 66.2% | 64.1% |
| Interquartile Range (IQR) | 28.3% | 27.6% |
| Standard Deviation (Sample) | 22.8% | 22.5% |
| Standard Deviation (Population) | 22.3% | 22.1% |
Demographics Similar to Ute and Cheyenne by Single Mother Poverty
In terms of single mother poverty, the demographic groups most similar to Ute are Seminole (35.8%, a difference of 0.30%), Ottawa (35.5%, a difference of 0.48%), Kiowa (35.5%, a difference of 0.69%), Black/African American (35.2%, a difference of 1.4%), and Paiute (35.1%, a difference of 1.6%). Similarly, the demographic groups most similar to Cheyenne are Immigrants from Yemen (38.5%, a difference of 0.040%), Pima (38.6%, a difference of 0.25%), Crow (38.6%, a difference of 0.34%), Sioux (38.8%, a difference of 0.74%), and Yuman (37.8%, a difference of 1.9%).
| Demographics | Rating | Rank | Single Mother Poverty |
| Iroquois | 0.0 /100 | #320 | Tragic 34.8% |
| Paiute | 0.0 /100 | #321 | Tragic 35.1% |
| Blacks/African Americans | 0.0 /100 | #322 | Tragic 35.2% |
| Kiowa | 0.0 /100 | #323 | Tragic 35.5% |
| Ottawa | 0.0 /100 | #324 | Tragic 35.5% |
| Ute | 0.0 /100 | #325 | Tragic 35.7% |
| Seminole | 0.0 /100 | #326 | Tragic 35.8% |
| Yakama | 0.0 /100 | #327 | Tragic 36.4% |
| Choctaw | 0.0 /100 | #328 | Tragic 36.4% |
| Apache | 0.0 /100 | #329 | Tragic 36.6% |
| Natives/Alaskans | 0.0 /100 | #330 | Tragic 36.6% |
| Creek | 0.0 /100 | #331 | Tragic 36.7% |
| Dutch West Indians | 0.0 /100 | #332 | Tragic 36.8% |
| Menominee | 0.0 /100 | #333 | Tragic 37.1% |
| Pueblo | 0.0 /100 | #334 | Tragic 37.2% |
| Yuman | 0.0 /100 | #335 | Tragic 37.8% |
| Cheyenne | 0.0 /100 | #336 | Tragic 38.5% |
| Immigrants | Yemen | 0.0 /100 | #337 | Tragic 38.5% |
| Pima | 0.0 /100 | #338 | Tragic 38.6% |
| Crow | 0.0 /100 | #339 | Tragic 38.6% |
| Sioux | 0.0 /100 | #340 | Tragic 38.8% |