Israeli vs Immigrants from North America Male Poverty
COMPARE
Israeli
Immigrants from North America
Male Poverty
Male Poverty Comparison
Israelis
Immigrants from North America
11.5%
MALE POVERTY
26.1/ 100
METRIC RATING
190th/ 347
METRIC RANK
10.3%
MALE POVERTY
96.5/ 100
METRIC RATING
79th/ 347
METRIC RANK
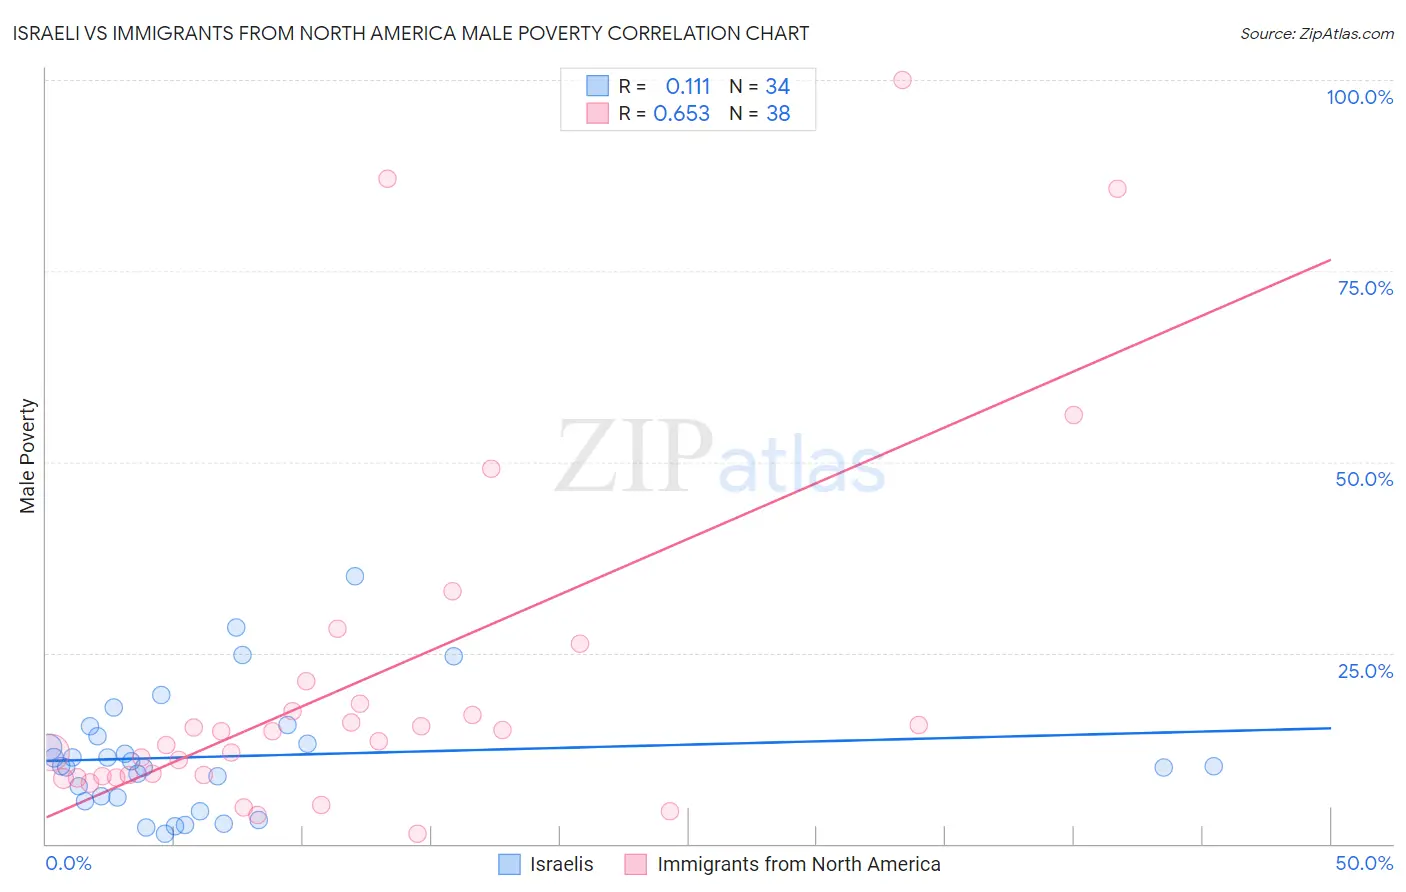
Israeli vs Immigrants from North America Male Poverty Correlation Chart
The statistical analysis conducted on geographies consisting of 210,981,593 people shows a poor positive correlation between the proportion of Israelis and poverty level among males in the United States with a correlation coefficient (R) of 0.111 and weighted average of 11.5%. Similarly, the statistical analysis conducted on geographies consisting of 461,883,462 people shows a significant positive correlation between the proportion of Immigrants from North America and poverty level among males in the United States with a correlation coefficient (R) of 0.653 and weighted average of 10.3%, a difference of 11.6%.
Male Poverty Correlation Summary
| Measurement | Israeli | Immigrants from North America |
| Minimum | 1.2% | 1.3% |
| Maximum | 35.0% | 100.0% |
| Range | 33.8% | 98.8% |
| Mean | 11.4% | 21.2% |
| Median | 10.2% | 14.1% |
| Interquartile 25% (IQ1) | 6.0% | 8.9% |
| Interquartile 75% (IQ3) | 14.1% | 18.3% |
| Interquartile Range (IQR) | 8.1% | 9.5% |
| Standard Deviation (Sample) | 7.8% | 23.5% |
| Standard Deviation (Population) | 7.7% | 23.2% |
Similar Demographics by Male Poverty
Demographics Similar to Israelis by Male Poverty
In terms of male poverty, the demographic groups most similar to Israelis are Hawaiian (11.4%, a difference of 0.26%), South American Indian (11.5%, a difference of 0.43%), Sierra Leonean (11.4%, a difference of 0.45%), Immigrants from Iraq (11.4%, a difference of 0.67%), and Immigrants from Sierra Leone (11.4%, a difference of 0.79%).
| Demographics | Rating | Rank | Male Poverty |
| Kenyans | 38.4 /100 | #183 | Fair 11.3% |
| Immigrants | South America | 36.9 /100 | #184 | Fair 11.3% |
| Immigrants | Afghanistan | 33.3 /100 | #185 | Fair 11.4% |
| Immigrants | Sierra Leone | 32.9 /100 | #186 | Fair 11.4% |
| Immigrants | Iraq | 31.9 /100 | #187 | Fair 11.4% |
| Sierra Leoneans | 29.9 /100 | #188 | Fair 11.4% |
| Hawaiians | 28.3 /100 | #189 | Fair 11.4% |
| Israelis | 26.1 /100 | #190 | Fair 11.5% |
| South American Indians | 22.8 /100 | #191 | Fair 11.5% |
| Immigrants | Uruguay | 19.1 /100 | #192 | Poor 11.6% |
| Immigrants | Kuwait | 17.3 /100 | #193 | Poor 11.6% |
| Immigrants | Kenya | 16.1 /100 | #194 | Poor 11.6% |
| Arabs | 15.8 /100 | #195 | Poor 11.6% |
| Hmong | 15.8 /100 | #196 | Poor 11.6% |
| Delaware | 15.4 /100 | #197 | Poor 11.7% |
Demographics Similar to Immigrants from North America by Male Poverty
In terms of male poverty, the demographic groups most similar to Immigrants from North America are English (10.3%, a difference of 0.080%), Irish (10.3%, a difference of 0.24%), Immigrants from Belgium (10.3%, a difference of 0.26%), Dutch (10.2%, a difference of 0.29%), and Immigrants from Eastern Europe (10.2%, a difference of 0.30%).
| Demographics | Rating | Rank | Male Poverty |
| Immigrants | Canada | 97.1 /100 | #72 | Exceptional 10.2% |
| Immigrants | Asia | 97.0 /100 | #73 | Exceptional 10.2% |
| Immigrants | Eastern Europe | 96.9 /100 | #74 | Exceptional 10.2% |
| Carpatho Rusyns | 96.9 /100 | #75 | Exceptional 10.2% |
| Dutch | 96.9 /100 | #76 | Exceptional 10.2% |
| Immigrants | Belgium | 96.8 /100 | #77 | Exceptional 10.3% |
| Irish | 96.8 /100 | #78 | Exceptional 10.3% |
| Immigrants | North America | 96.5 /100 | #79 | Exceptional 10.3% |
| English | 96.4 /100 | #80 | Exceptional 10.3% |
| Belgians | 95.9 /100 | #81 | Exceptional 10.3% |
| Egyptians | 95.9 /100 | #82 | Exceptional 10.3% |
| Immigrants | Sweden | 95.7 /100 | #83 | Exceptional 10.3% |
| Czechoslovakians | 95.6 /100 | #84 | Exceptional 10.3% |
| Immigrants | England | 95.5 /100 | #85 | Exceptional 10.4% |
| Immigrants | Eastern Asia | 95.3 /100 | #86 | Exceptional 10.4% |