Israeli vs Immigrants from Sudan Professional Degree
COMPARE
Israeli
Immigrants from Sudan
Professional Degree
Professional Degree Comparison
Israelis
Immigrants from Sudan
6.9%
PROFESSIONAL DEGREE
100.0/ 100
METRIC RATING
12th/ 347
METRIC RANK
4.9%
PROFESSIONAL DEGREE
95.4/ 100
METRIC RATING
119th/ 347
METRIC RANK
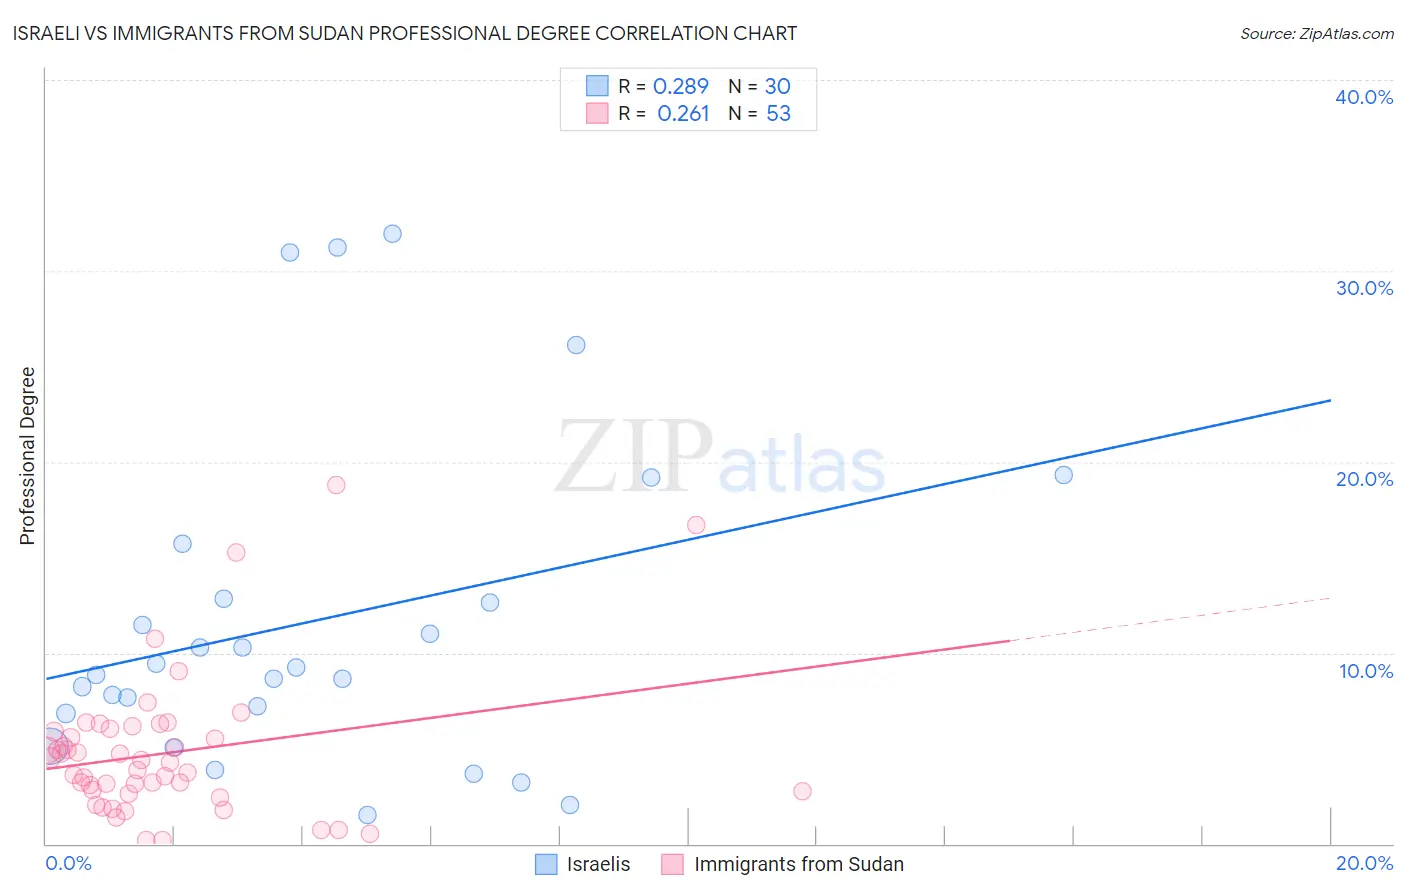
Israeli vs Immigrants from Sudan Professional Degree Correlation Chart
The statistical analysis conducted on geographies consisting of 210,967,538 people shows a weak positive correlation between the proportion of Israelis and percentage of population with at least professional degree education in the United States with a correlation coefficient (R) of 0.289 and weighted average of 6.9%. Similarly, the statistical analysis conducted on geographies consisting of 118,905,471 people shows a weak positive correlation between the proportion of Immigrants from Sudan and percentage of population with at least professional degree education in the United States with a correlation coefficient (R) of 0.261 and weighted average of 4.9%, a difference of 41.8%.
Professional Degree Correlation Summary
| Measurement | Israeli | Immigrants from Sudan |
| Minimum | 1.5% | 0.17% |
| Maximum | 31.9% | 18.8% |
| Range | 30.5% | 18.6% |
| Mean | 11.7% | 4.8% |
| Median | 9.0% | 4.2% |
| Interquartile 25% (IQ1) | 6.8% | 2.7% |
| Interquartile 75% (IQ3) | 12.9% | 6.0% |
| Interquartile Range (IQR) | 6.0% | 3.3% |
| Standard Deviation (Sample) | 8.5% | 3.7% |
| Standard Deviation (Population) | 8.4% | 3.7% |
Similar Demographics by Professional Degree
Demographics Similar to Israelis by Professional Degree
In terms of professional degree, the demographic groups most similar to Israelis are Cypriot (6.9%, a difference of 0.070%), Immigrants from Belgium (7.0%, a difference of 0.24%), Immigrants from Australia (6.9%, a difference of 0.43%), Immigrants from France (6.8%, a difference of 1.9%), and Immigrants from Taiwan (7.1%, a difference of 2.0%).
| Demographics | Rating | Rank | Professional Degree |
| Immigrants | Iran | 100.0 /100 | #5 | Exceptional 7.3% |
| Okinawans | 100.0 /100 | #6 | Exceptional 7.3% |
| Eastern Europeans | 100.0 /100 | #7 | Exceptional 7.1% |
| Immigrants | Switzerland | 100.0 /100 | #8 | Exceptional 7.1% |
| Immigrants | Taiwan | 100.0 /100 | #9 | Exceptional 7.1% |
| Immigrants | Belgium | 100.0 /100 | #10 | Exceptional 7.0% |
| Cypriots | 100.0 /100 | #11 | Exceptional 6.9% |
| Israelis | 100.0 /100 | #12 | Exceptional 6.9% |
| Immigrants | Australia | 100.0 /100 | #13 | Exceptional 6.9% |
| Immigrants | France | 100.0 /100 | #14 | Exceptional 6.8% |
| Immigrants | China | 100.0 /100 | #15 | Exceptional 6.7% |
| Immigrants | Sweden | 100.0 /100 | #16 | Exceptional 6.7% |
| Immigrants | Eastern Asia | 100.0 /100 | #17 | Exceptional 6.6% |
| Soviet Union | 100.0 /100 | #18 | Exceptional 6.6% |
| Indians (Asian) | 100.0 /100 | #19 | Exceptional 6.5% |
Demographics Similar to Immigrants from Sudan by Professional Degree
In terms of professional degree, the demographic groups most similar to Immigrants from Sudan are Albanian (4.9%, a difference of 0.010%), Immigrants from Moldova (4.9%, a difference of 0.36%), Immigrants from Syria (4.9%, a difference of 0.54%), Croatian (4.9%, a difference of 0.54%), and Venezuelan (4.9%, a difference of 0.75%).
| Demographics | Rating | Rank | Professional Degree |
| Taiwanese | 97.3 /100 | #112 | Exceptional 5.0% |
| Immigrants | Pakistan | 97.2 /100 | #113 | Exceptional 5.0% |
| Immigrants | Morocco | 96.8 /100 | #114 | Exceptional 5.0% |
| Moroccans | 96.8 /100 | #115 | Exceptional 5.0% |
| Venezuelans | 96.3 /100 | #116 | Exceptional 4.9% |
| Immigrants | Syria | 96.0 /100 | #117 | Exceptional 4.9% |
| Croatians | 96.0 /100 | #118 | Exceptional 4.9% |
| Immigrants | Sudan | 95.4 /100 | #119 | Exceptional 4.9% |
| Albanians | 95.3 /100 | #120 | Exceptional 4.9% |
| Immigrants | Moldova | 94.8 /100 | #121 | Exceptional 4.9% |
| Immigrants | Germany | 94.1 /100 | #122 | Exceptional 4.9% |
| Immigrants | Venezuela | 93.8 /100 | #123 | Exceptional 4.8% |
| Immigrants | Eritrea | 93.5 /100 | #124 | Exceptional 4.8% |
| Immigrants | Albania | 93.3 /100 | #125 | Exceptional 4.8% |
| Europeans | 93.2 /100 | #126 | Exceptional 4.8% |