Iroquois vs Slovene Single Mother Poverty
COMPARE
Iroquois
Slovene
Single Mother Poverty
Single Mother Poverty Comparison
Iroquois
Slovenes
34.8%
SINGLE MOTHER POVERTY
0.0/ 100
METRIC RATING
320th/ 347
METRIC RANK
28.8%
SINGLE MOTHER POVERTY
76.4/ 100
METRIC RATING
153rd/ 347
METRIC RANK
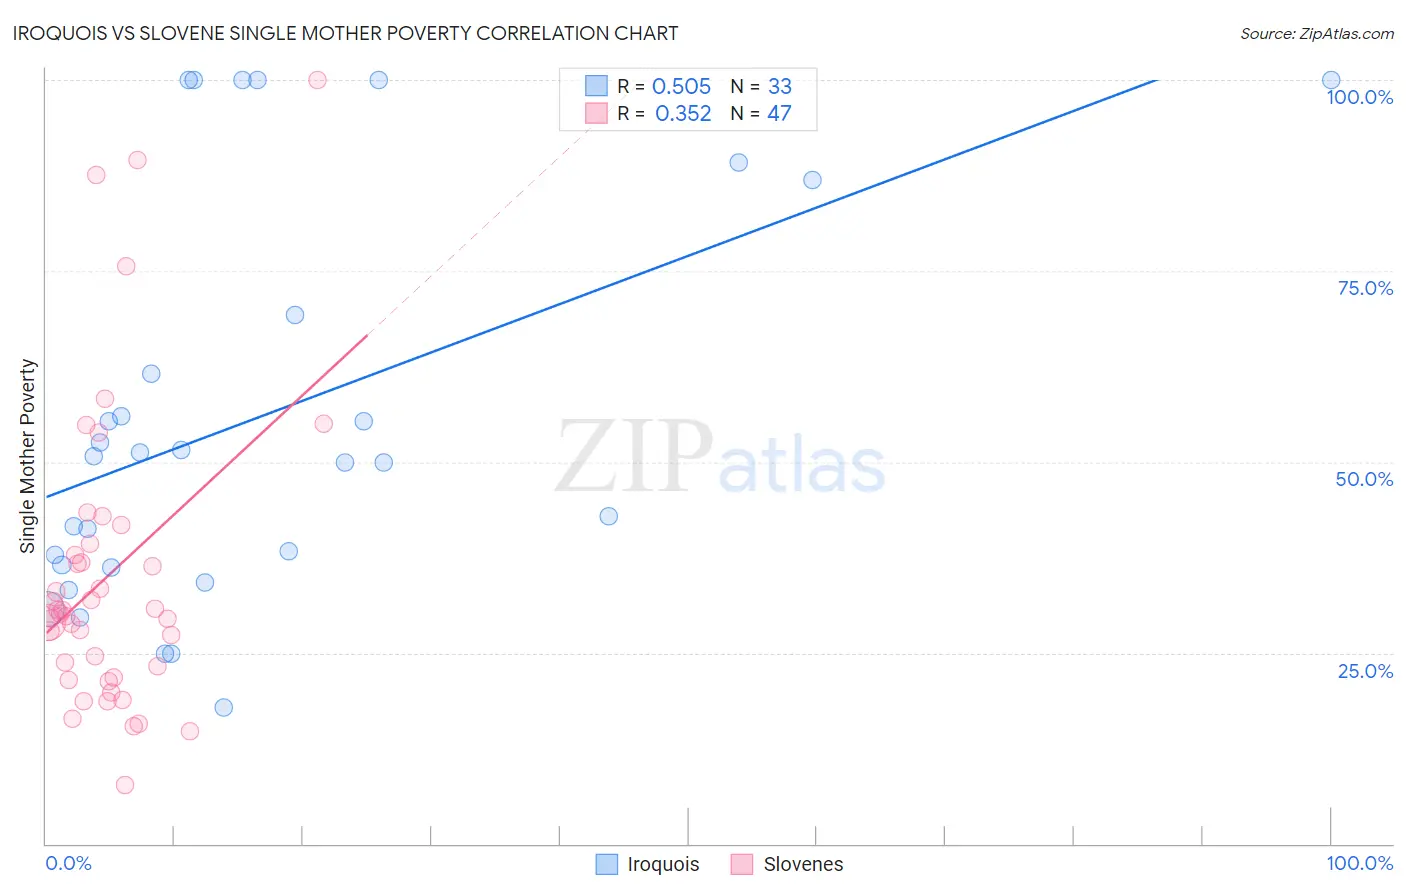
Iroquois vs Slovene Single Mother Poverty Correlation Chart
The statistical analysis conducted on geographies consisting of 204,844,819 people shows a substantial positive correlation between the proportion of Iroquois and poverty level among single mothers in the United States with a correlation coefficient (R) of 0.505 and weighted average of 34.8%. Similarly, the statistical analysis conducted on geographies consisting of 255,975,131 people shows a mild positive correlation between the proportion of Slovenes and poverty level among single mothers in the United States with a correlation coefficient (R) of 0.352 and weighted average of 28.8%, a difference of 21.2%.
Single Mother Poverty Correlation Summary
| Measurement | Iroquois | Slovene |
| Minimum | 17.9% | 7.7% |
| Maximum | 100.0% | 100.0% |
| Range | 82.1% | 92.3% |
| Mean | 56.0% | 35.2% |
| Median | 50.8% | 30.1% |
| Interquartile 25% (IQ1) | 36.4% | 21.7% |
| Interquartile 75% (IQ3) | 78.1% | 39.2% |
| Interquartile Range (IQR) | 41.7% | 17.5% |
| Standard Deviation (Sample) | 26.1% | 19.9% |
| Standard Deviation (Population) | 25.7% | 19.6% |
Similar Demographics by Single Mother Poverty
Demographics Similar to Iroquois by Single Mother Poverty
In terms of single mother poverty, the demographic groups most similar to Iroquois are Chippewa (34.8%, a difference of 0.24%), Immigrants from Honduras (34.7%, a difference of 0.39%), Paiute (35.1%, a difference of 0.87%), Cherokee (34.5%, a difference of 0.91%), and Dominican (34.5%, a difference of 1.0%).
| Demographics | Rating | Rank | Single Mother Poverty |
| Immigrants | Dominican Republic | 0.0 /100 | #313 | Tragic 34.4% |
| Chickasaw | 0.0 /100 | #314 | Tragic 34.4% |
| Hopi | 0.0 /100 | #315 | Tragic 34.5% |
| Dominicans | 0.0 /100 | #316 | Tragic 34.5% |
| Cherokee | 0.0 /100 | #317 | Tragic 34.5% |
| Immigrants | Honduras | 0.0 /100 | #318 | Tragic 34.7% |
| Chippewa | 0.0 /100 | #319 | Tragic 34.8% |
| Iroquois | 0.0 /100 | #320 | Tragic 34.8% |
| Paiute | 0.0 /100 | #321 | Tragic 35.1% |
| Blacks/African Americans | 0.0 /100 | #322 | Tragic 35.2% |
| Kiowa | 0.0 /100 | #323 | Tragic 35.5% |
| Ottawa | 0.0 /100 | #324 | Tragic 35.5% |
| Ute | 0.0 /100 | #325 | Tragic 35.7% |
| Seminole | 0.0 /100 | #326 | Tragic 35.8% |
| Yakama | 0.0 /100 | #327 | Tragic 36.4% |
Demographics Similar to Slovenes by Single Mother Poverty
In terms of single mother poverty, the demographic groups most similar to Slovenes are Austrian (28.7%, a difference of 0.18%), Portuguese (28.8%, a difference of 0.21%), Immigrants from Oceania (28.7%, a difference of 0.25%), Ugandan (28.8%, a difference of 0.29%), and Iraqi (28.8%, a difference of 0.31%).
| Demographics | Rating | Rank | Single Mother Poverty |
| Immigrants | Denmark | 86.1 /100 | #146 | Excellent 28.5% |
| Immigrants | Lebanon | 85.3 /100 | #147 | Excellent 28.6% |
| Syrians | 85.3 /100 | #148 | Excellent 28.6% |
| Serbians | 85.0 /100 | #149 | Excellent 28.6% |
| Northern Europeans | 81.7 /100 | #150 | Excellent 28.6% |
| Immigrants | Oceania | 79.9 /100 | #151 | Good 28.7% |
| Austrians | 79.0 /100 | #152 | Good 28.7% |
| Slovenes | 76.4 /100 | #153 | Good 28.8% |
| Portuguese | 73.2 /100 | #154 | Good 28.8% |
| Ugandans | 71.7 /100 | #155 | Good 28.8% |
| Iraqis | 71.5 /100 | #156 | Good 28.8% |
| Immigrants | Western Europe | 71.1 /100 | #157 | Good 28.9% |
| Immigrants | Hungary | 70.6 /100 | #158 | Good 28.9% |
| Czechs | 68.4 /100 | #159 | Good 28.9% |
| Japanese | 68.0 /100 | #160 | Good 28.9% |