Iroquois vs Chippewa Single Mother Poverty
COMPARE
Iroquois
Chippewa
Single Mother Poverty
Single Mother Poverty Comparison
Iroquois
Chippewa
34.8%
SINGLE MOTHER POVERTY
0.0/ 100
METRIC RATING
320th/ 347
METRIC RANK
34.8%
SINGLE MOTHER POVERTY
0.0/ 100
METRIC RATING
319th/ 347
METRIC RANK
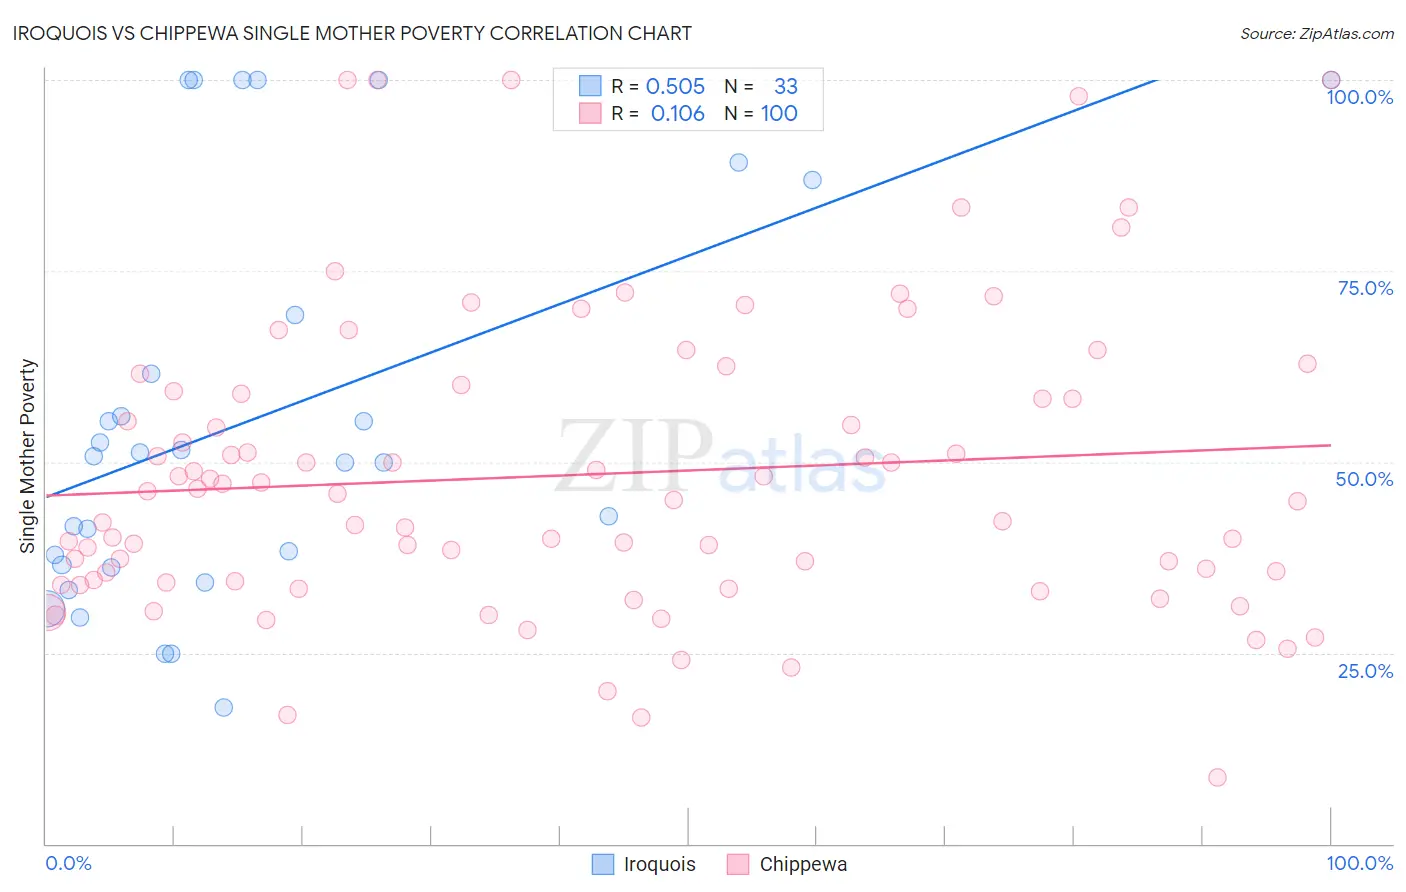
Iroquois vs Chippewa Single Mother Poverty Correlation Chart
The statistical analysis conducted on geographies consisting of 204,844,819 people shows a substantial positive correlation between the proportion of Iroquois and poverty level among single mothers in the United States with a correlation coefficient (R) of 0.505 and weighted average of 34.8%. Similarly, the statistical analysis conducted on geographies consisting of 212,048,110 people shows a poor positive correlation between the proportion of Chippewa and poverty level among single mothers in the United States with a correlation coefficient (R) of 0.106 and weighted average of 34.8%, a difference of 0.24%.
Single Mother Poverty Correlation Summary
| Measurement | Iroquois | Chippewa |
| Minimum | 17.9% | 8.7% |
| Maximum | 100.0% | 100.0% |
| Range | 82.1% | 91.3% |
| Mean | 56.0% | 48.3% |
| Median | 50.8% | 45.4% |
| Interquartile 25% (IQ1) | 36.4% | 34.3% |
| Interquartile 75% (IQ3) | 78.1% | 59.1% |
| Interquartile Range (IQR) | 41.7% | 24.8% |
| Standard Deviation (Sample) | 26.1% | 19.5% |
| Standard Deviation (Population) | 25.7% | 19.4% |
Demographics Similar to Iroquois and Chippewa by Single Mother Poverty
In terms of single mother poverty, the demographic groups most similar to Iroquois are Immigrants from Honduras (34.7%, a difference of 0.39%), Paiute (35.1%, a difference of 0.87%), Cherokee (34.5%, a difference of 0.91%), Dominican (34.5%, a difference of 1.0%), and Black/African American (35.2%, a difference of 1.1%). Similarly, the demographic groups most similar to Chippewa are Immigrants from Honduras (34.7%, a difference of 0.15%), Cherokee (34.5%, a difference of 0.67%), Dominican (34.5%, a difference of 0.78%), Hopi (34.5%, a difference of 0.90%), and Chickasaw (34.4%, a difference of 0.98%).
| Demographics | Rating | Rank | Single Mother Poverty |
| Potawatomi | 0.0 /100 | #309 | Tragic 34.1% |
| Hondurans | 0.0 /100 | #310 | Tragic 34.2% |
| Alsatians | 0.0 /100 | #311 | Tragic 34.3% |
| Central American Indians | 0.0 /100 | #312 | Tragic 34.3% |
| Immigrants | Dominican Republic | 0.0 /100 | #313 | Tragic 34.4% |
| Chickasaw | 0.0 /100 | #314 | Tragic 34.4% |
| Hopi | 0.0 /100 | #315 | Tragic 34.5% |
| Dominicans | 0.0 /100 | #316 | Tragic 34.5% |
| Cherokee | 0.0 /100 | #317 | Tragic 34.5% |
| Immigrants | Honduras | 0.0 /100 | #318 | Tragic 34.7% |
| Chippewa | 0.0 /100 | #319 | Tragic 34.8% |
| Iroquois | 0.0 /100 | #320 | Tragic 34.8% |
| Paiute | 0.0 /100 | #321 | Tragic 35.1% |
| Blacks/African Americans | 0.0 /100 | #322 | Tragic 35.2% |
| Kiowa | 0.0 /100 | #323 | Tragic 35.5% |
| Ottawa | 0.0 /100 | #324 | Tragic 35.5% |
| Ute | 0.0 /100 | #325 | Tragic 35.7% |
| Seminole | 0.0 /100 | #326 | Tragic 35.8% |
| Yakama | 0.0 /100 | #327 | Tragic 36.4% |
| Choctaw | 0.0 /100 | #328 | Tragic 36.4% |
| Apache | 0.0 /100 | #329 | Tragic 36.6% |