Irish vs Immigrants from Burma/Myanmar Child Poverty Under the Age of 5
COMPARE
Irish
Immigrants from Burma/Myanmar
Child Poverty Under the Age of 5
Child Poverty Under the Age of 5 Comparison
Irish
Immigrants from Burma/Myanmar
16.8%
CHILD POVERTY UNDER THE AGE OF 5
72.0/ 100
METRIC RATING
160th/ 347
METRIC RANK
20.4%
CHILD POVERTY UNDER THE AGE OF 5
0.1/ 100
METRIC RATING
269th/ 347
METRIC RANK
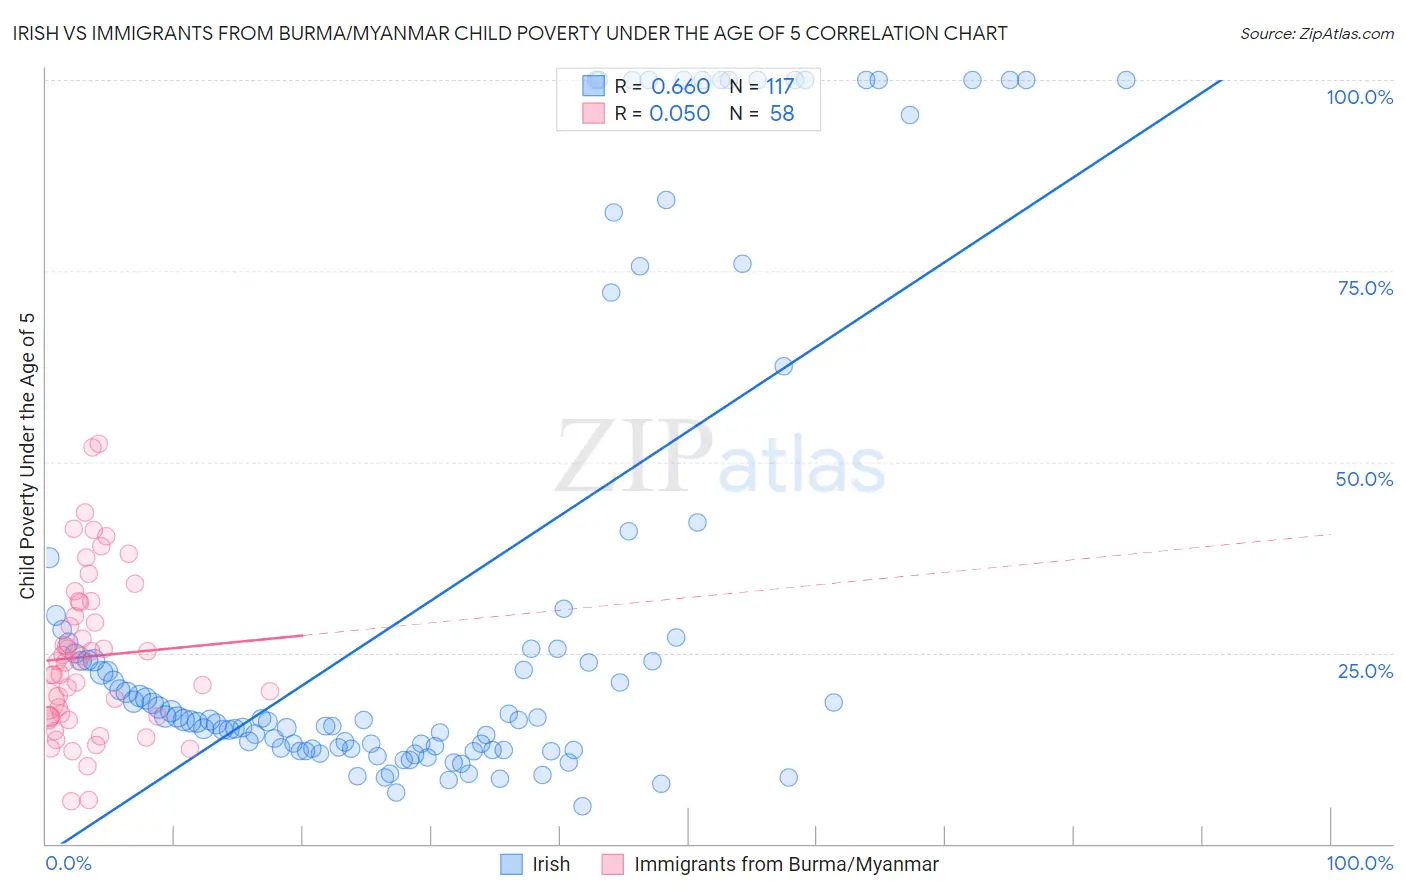
Irish vs Immigrants from Burma/Myanmar Child Poverty Under the Age of 5 Correlation Chart
The statistical analysis conducted on geographies consisting of 536,582,849 people shows a significant positive correlation between the proportion of Irish and poverty level among children under the age of 5 in the United States with a correlation coefficient (R) of 0.660 and weighted average of 16.8%. Similarly, the statistical analysis conducted on geographies consisting of 169,386,512 people shows a slight positive correlation between the proportion of Immigrants from Burma/Myanmar and poverty level among children under the age of 5 in the United States with a correlation coefficient (R) of 0.050 and weighted average of 20.4%, a difference of 21.1%.
Child Poverty Under the Age of 5 Correlation Summary
| Measurement | Irish | Immigrants from Burma/Myanmar |
| Minimum | 4.9% | 5.5% |
| Maximum | 100.0% | 52.3% |
| Range | 95.1% | 46.9% |
| Mean | 32.4% | 24.5% |
| Median | 16.4% | 23.8% |
| Interquartile 25% (IQ1) | 12.5% | 16.7% |
| Interquartile 75% (IQ3) | 29.0% | 31.6% |
| Interquartile Range (IQR) | 16.5% | 15.0% |
| Standard Deviation (Sample) | 32.3% | 10.5% |
| Standard Deviation (Population) | 32.1% | 10.4% |
Similar Demographics by Child Poverty Under the Age of 5
Demographics Similar to Irish by Child Poverty Under the Age of 5
In terms of child poverty under the age of 5, the demographic groups most similar to Irish are Immigrants from Syria (16.8%, a difference of 0.030%), Czechoslovakian (16.8%, a difference of 0.060%), English (16.8%, a difference of 0.22%), Venezuelan (16.8%, a difference of 0.23%), and Costa Rican (16.9%, a difference of 0.28%).
| Demographics | Rating | Rank | Child Poverty Under the Age of 5 |
| Dutch | 77.1 /100 | #153 | Good 16.7% |
| Immigrants | Venezuela | 76.0 /100 | #154 | Good 16.7% |
| South Americans | 75.1 /100 | #155 | Good 16.7% |
| Afghans | 74.4 /100 | #156 | Good 16.8% |
| Venezuelans | 73.7 /100 | #157 | Good 16.8% |
| Czechoslovakians | 72.5 /100 | #158 | Good 16.8% |
| Immigrants | Syria | 72.3 /100 | #159 | Good 16.8% |
| Irish | 72.0 /100 | #160 | Good 16.8% |
| English | 70.4 /100 | #161 | Good 16.8% |
| Costa Ricans | 69.8 /100 | #162 | Good 16.9% |
| Scottish | 68.6 /100 | #163 | Good 16.9% |
| Immigrants | Oceania | 67.6 /100 | #164 | Good 16.9% |
| Immigrants | Colombia | 66.9 /100 | #165 | Good 16.9% |
| Slavs | 64.0 /100 | #166 | Good 17.0% |
| Immigrants | Uzbekistan | 62.0 /100 | #167 | Good 17.0% |
Demographics Similar to Immigrants from Burma/Myanmar by Child Poverty Under the Age of 5
In terms of child poverty under the age of 5, the demographic groups most similar to Immigrants from Burma/Myanmar are Jamaican (20.4%, a difference of 0.070%), Ottawa (20.3%, a difference of 0.090%), Belizean (20.3%, a difference of 0.090%), Aleut (20.3%, a difference of 0.48%), and American (20.5%, a difference of 0.52%).
| Demographics | Rating | Rank | Child Poverty Under the Age of 5 |
| Liberians | 0.1 /100 | #262 | Tragic 20.2% |
| Barbadians | 0.1 /100 | #263 | Tragic 20.2% |
| Immigrants | Liberia | 0.1 /100 | #264 | Tragic 20.2% |
| Spanish American Indians | 0.1 /100 | #265 | Tragic 20.2% |
| Aleuts | 0.1 /100 | #266 | Tragic 20.3% |
| Ottawa | 0.1 /100 | #267 | Tragic 20.3% |
| Belizeans | 0.1 /100 | #268 | Tragic 20.3% |
| Immigrants | Burma/Myanmar | 0.1 /100 | #269 | Tragic 20.4% |
| Jamaicans | 0.1 /100 | #270 | Tragic 20.4% |
| Americans | 0.1 /100 | #271 | Tragic 20.5% |
| Immigrants | Jamaica | 0.1 /100 | #272 | Tragic 20.5% |
| Central Americans | 0.1 /100 | #273 | Tragic 20.6% |
| Immigrants | Belize | 0.1 /100 | #274 | Tragic 20.6% |
| Bangladeshis | 0.1 /100 | #275 | Tragic 20.6% |
| West Indians | 0.0 /100 | #276 | Tragic 20.6% |