Irish vs Immigrants from Trinidad and Tobago Child Poverty Under the Age of 5
COMPARE
Irish
Immigrants from Trinidad and Tobago
Child Poverty Under the Age of 5
Child Poverty Under the Age of 5 Comparison
Irish
Immigrants from Trinidad and Tobago
16.8%
CHILD POVERTY UNDER THE AGE OF 5
72.0/ 100
METRIC RATING
160th/ 347
METRIC RANK
19.4%
CHILD POVERTY UNDER THE AGE OF 5
0.8/ 100
METRIC RATING
236th/ 347
METRIC RANK
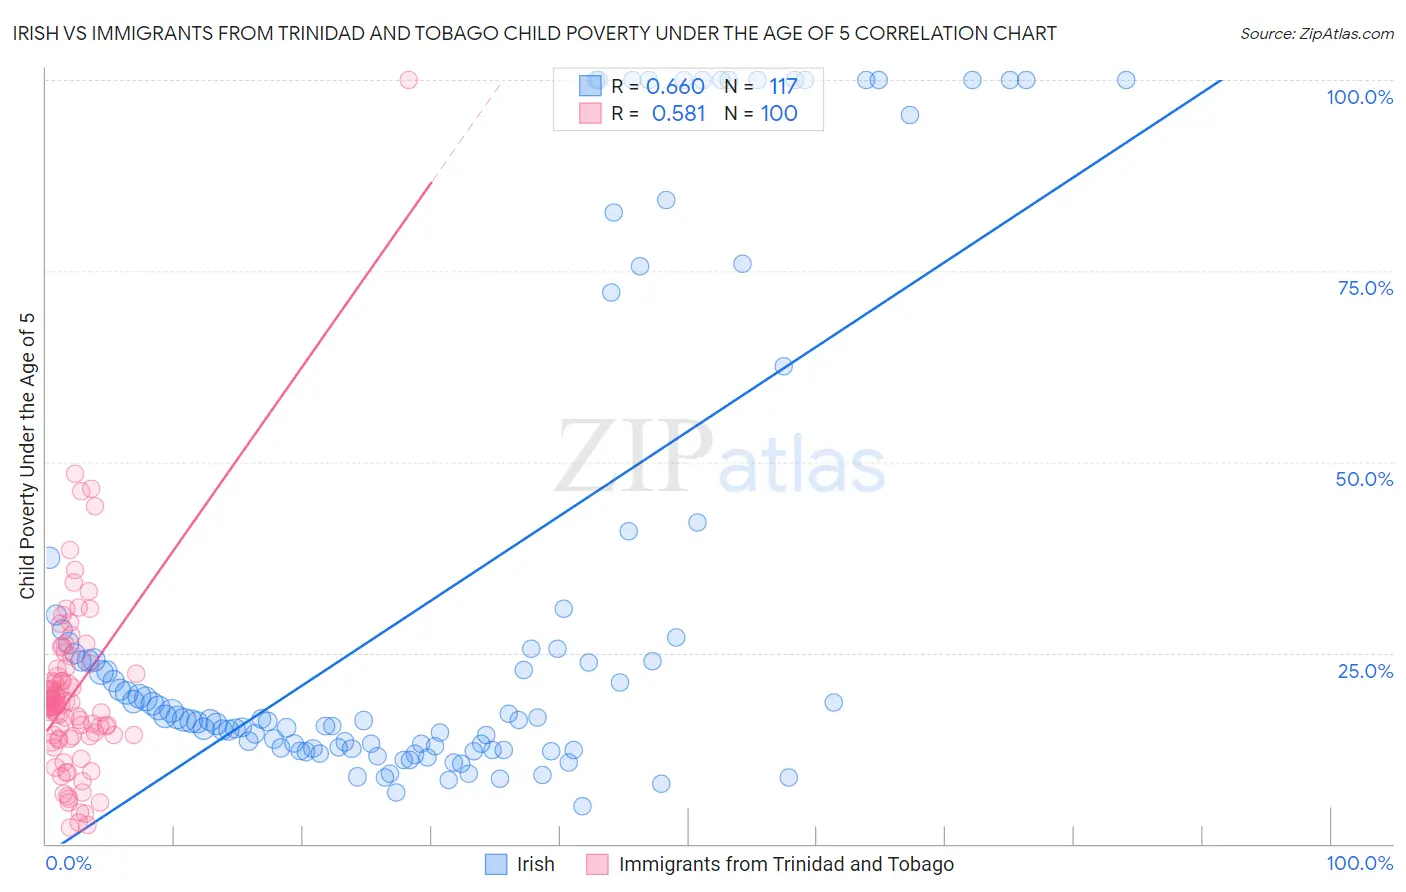
Irish vs Immigrants from Trinidad and Tobago Child Poverty Under the Age of 5 Correlation Chart
The statistical analysis conducted on geographies consisting of 536,582,849 people shows a significant positive correlation between the proportion of Irish and poverty level among children under the age of 5 in the United States with a correlation coefficient (R) of 0.660 and weighted average of 16.8%. Similarly, the statistical analysis conducted on geographies consisting of 218,090,061 people shows a substantial positive correlation between the proportion of Immigrants from Trinidad and Tobago and poverty level among children under the age of 5 in the United States with a correlation coefficient (R) of 0.581 and weighted average of 19.4%, a difference of 15.4%.
Child Poverty Under the Age of 5 Correlation Summary
| Measurement | Irish | Immigrants from Trinidad and Tobago |
| Minimum | 4.9% | 2.2% |
| Maximum | 100.0% | 100.0% |
| Range | 95.1% | 97.8% |
| Mean | 32.4% | 19.7% |
| Median | 16.4% | 18.1% |
| Interquartile 25% (IQ1) | 12.5% | 14.1% |
| Interquartile 75% (IQ3) | 29.0% | 22.6% |
| Interquartile Range (IQR) | 16.5% | 8.5% |
| Standard Deviation (Sample) | 32.3% | 12.4% |
| Standard Deviation (Population) | 32.1% | 12.3% |
Similar Demographics by Child Poverty Under the Age of 5
Demographics Similar to Irish by Child Poverty Under the Age of 5
In terms of child poverty under the age of 5, the demographic groups most similar to Irish are Immigrants from Syria (16.8%, a difference of 0.030%), Czechoslovakian (16.8%, a difference of 0.060%), English (16.8%, a difference of 0.22%), Venezuelan (16.8%, a difference of 0.23%), and Costa Rican (16.9%, a difference of 0.28%).
| Demographics | Rating | Rank | Child Poverty Under the Age of 5 |
| Dutch | 77.1 /100 | #153 | Good 16.7% |
| Immigrants | Venezuela | 76.0 /100 | #154 | Good 16.7% |
| South Americans | 75.1 /100 | #155 | Good 16.7% |
| Afghans | 74.4 /100 | #156 | Good 16.8% |
| Venezuelans | 73.7 /100 | #157 | Good 16.8% |
| Czechoslovakians | 72.5 /100 | #158 | Good 16.8% |
| Immigrants | Syria | 72.3 /100 | #159 | Good 16.8% |
| Irish | 72.0 /100 | #160 | Good 16.8% |
| English | 70.4 /100 | #161 | Good 16.8% |
| Costa Ricans | 69.8 /100 | #162 | Good 16.9% |
| Scottish | 68.6 /100 | #163 | Good 16.9% |
| Immigrants | Oceania | 67.6 /100 | #164 | Good 16.9% |
| Immigrants | Colombia | 66.9 /100 | #165 | Good 16.9% |
| Slavs | 64.0 /100 | #166 | Good 17.0% |
| Immigrants | Uzbekistan | 62.0 /100 | #167 | Good 17.0% |
Demographics Similar to Immigrants from Trinidad and Tobago by Child Poverty Under the Age of 5
In terms of child poverty under the age of 5, the demographic groups most similar to Immigrants from Trinidad and Tobago are Immigrants from Laos (19.4%, a difference of 0.0%), Immigrants from Micronesia (19.4%, a difference of 0.21%), Sudanese (19.3%, a difference of 0.34%), Trinidadian and Tobagonian (19.3%, a difference of 0.39%), and Immigrants from Cabo Verde (19.5%, a difference of 0.55%).
| Demographics | Rating | Rank | Child Poverty Under the Age of 5 |
| Ghanaians | 1.2 /100 | #229 | Tragic 19.2% |
| Ecuadorians | 1.2 /100 | #230 | Tragic 19.2% |
| Bermudans | 1.2 /100 | #231 | Tragic 19.2% |
| Trinidadians and Tobagonians | 0.9 /100 | #232 | Tragic 19.3% |
| Sudanese | 0.9 /100 | #233 | Tragic 19.3% |
| Immigrants | Micronesia | 0.9 /100 | #234 | Tragic 19.4% |
| Immigrants | Laos | 0.8 /100 | #235 | Tragic 19.4% |
| Immigrants | Trinidad and Tobago | 0.8 /100 | #236 | Tragic 19.4% |
| Immigrants | Cabo Verde | 0.6 /100 | #237 | Tragic 19.5% |
| Salvadorans | 0.6 /100 | #238 | Tragic 19.5% |
| Vietnamese | 0.6 /100 | #239 | Tragic 19.5% |
| Immigrants | Ecuador | 0.5 /100 | #240 | Tragic 19.6% |
| Alaska Natives | 0.5 /100 | #241 | Tragic 19.6% |
| Immigrants | Guyana | 0.5 /100 | #242 | Tragic 19.6% |
| Osage | 0.5 /100 | #243 | Tragic 19.6% |