Irish vs Immigrants from Chile Family Households
COMPARE
Irish
Immigrants from Chile
Family Households
Family Households Comparison
Irish
Immigrants from Chile
64.4%
FAMILY HOUSEHOLDS
57.9/ 100
METRIC RATING
167th/ 347
METRIC RANK
64.6%
FAMILY HOUSEHOLDS
76.5/ 100
METRIC RATING
147th/ 347
METRIC RANK
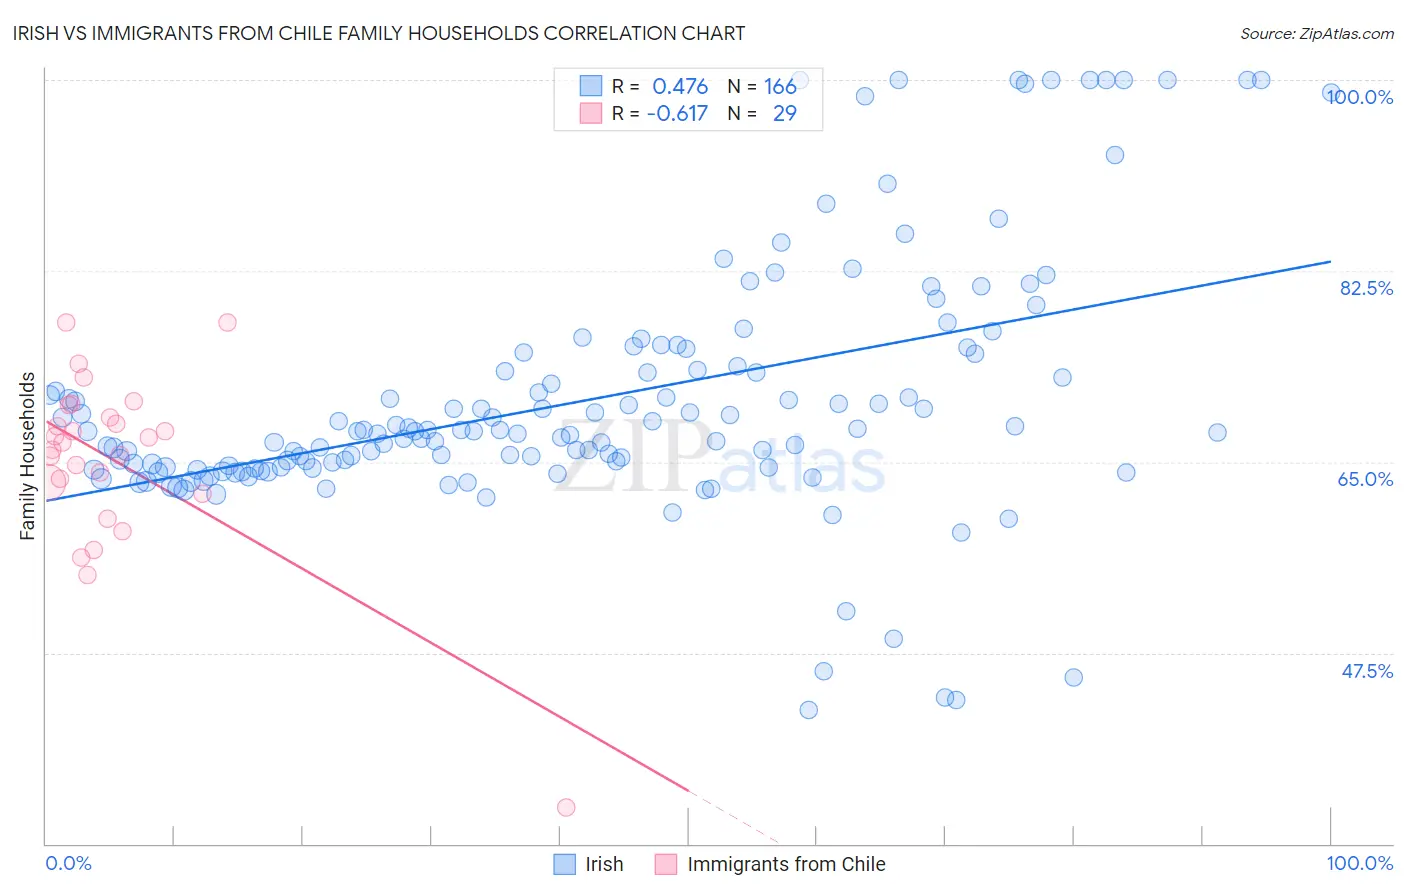
Irish vs Immigrants from Chile Family Households Correlation Chart
The statistical analysis conducted on geographies consisting of 580,015,491 people shows a moderate positive correlation between the proportion of Irish and percentage of family households in the United States with a correlation coefficient (R) of 0.476 and weighted average of 64.4%. Similarly, the statistical analysis conducted on geographies consisting of 218,601,267 people shows a significant negative correlation between the proportion of Immigrants from Chile and percentage of family households in the United States with a correlation coefficient (R) of -0.617 and weighted average of 64.6%, a difference of 0.29%.
Family Households Correlation Summary
| Measurement | Irish | Immigrants from Chile |
| Minimum | 42.2% | 33.3% |
| Maximum | 100.0% | 77.8% |
| Range | 57.8% | 44.5% |
| Mean | 70.7% | 65.2% |
| Median | 67.8% | 66.8% |
| Interquartile 25% (IQ1) | 64.5% | 62.6% |
| Interquartile 75% (IQ3) | 73.8% | 69.7% |
| Interquartile Range (IQR) | 9.3% | 7.0% |
| Standard Deviation (Sample) | 11.6% | 8.4% |
| Standard Deviation (Population) | 11.5% | 8.2% |
Demographics Similar to Irish and Immigrants from Chile by Family Households
In terms of family households, the demographic groups most similar to Irish are Scotch-Irish (64.4%, a difference of 0.020%), Immigrants from Nigeria (64.4%, a difference of 0.030%), Immigrants from Southern Europe (64.4%, a difference of 0.030%), British (64.4%, a difference of 0.050%), and Chickasaw (64.4%, a difference of 0.050%). Similarly, the demographic groups most similar to Immigrants from Chile are Delaware (64.6%, a difference of 0.0%), Sioux (64.6%, a difference of 0.0%), Romanian (64.5%, a difference of 0.020%), Syrian (64.5%, a difference of 0.020%), and Scottish (64.5%, a difference of 0.10%).
| Demographics | Rating | Rank | Family Households |
| Immigrants | Chile | 76.5 /100 | #147 | Good 64.6% |
| Delaware | 76.3 /100 | #148 | Good 64.6% |
| Sioux | 76.3 /100 | #149 | Good 64.6% |
| Romanians | 75.3 /100 | #150 | Good 64.5% |
| Syrians | 75.2 /100 | #151 | Good 64.5% |
| Scottish | 70.9 /100 | #152 | Good 64.5% |
| Swedes | 69.8 /100 | #153 | Good 64.5% |
| Austrians | 68.5 /100 | #154 | Good 64.5% |
| Uruguayans | 67.7 /100 | #155 | Good 64.5% |
| Czechs | 67.0 /100 | #156 | Good 64.5% |
| Canadians | 66.6 /100 | #157 | Good 64.4% |
| Lebanese | 66.4 /100 | #158 | Good 64.4% |
| Germans | 65.8 /100 | #159 | Good 64.4% |
| Immigrants | Moldova | 65.2 /100 | #160 | Good 64.4% |
| Immigrants | England | 62.6 /100 | #161 | Good 64.4% |
| British | 61.6 /100 | #162 | Good 64.4% |
| Chickasaw | 61.5 /100 | #163 | Good 64.4% |
| Immigrants | Nigeria | 60.1 /100 | #164 | Good 64.4% |
| Immigrants | Southern Europe | 60.0 /100 | #165 | Good 64.4% |
| Scotch-Irish | 59.2 /100 | #166 | Average 64.4% |
| Irish | 57.9 /100 | #167 | Average 64.4% |