Irish vs Ethiopian Poverty
COMPARE
Irish
Ethiopian
Poverty
Poverty Comparison
Irish
Ethiopians
11.3%
POVERTY
96.6/ 100
METRIC RATING
81st/ 347
METRIC RANK
12.2%
POVERTY
59.1/ 100
METRIC RATING
162nd/ 347
METRIC RANK
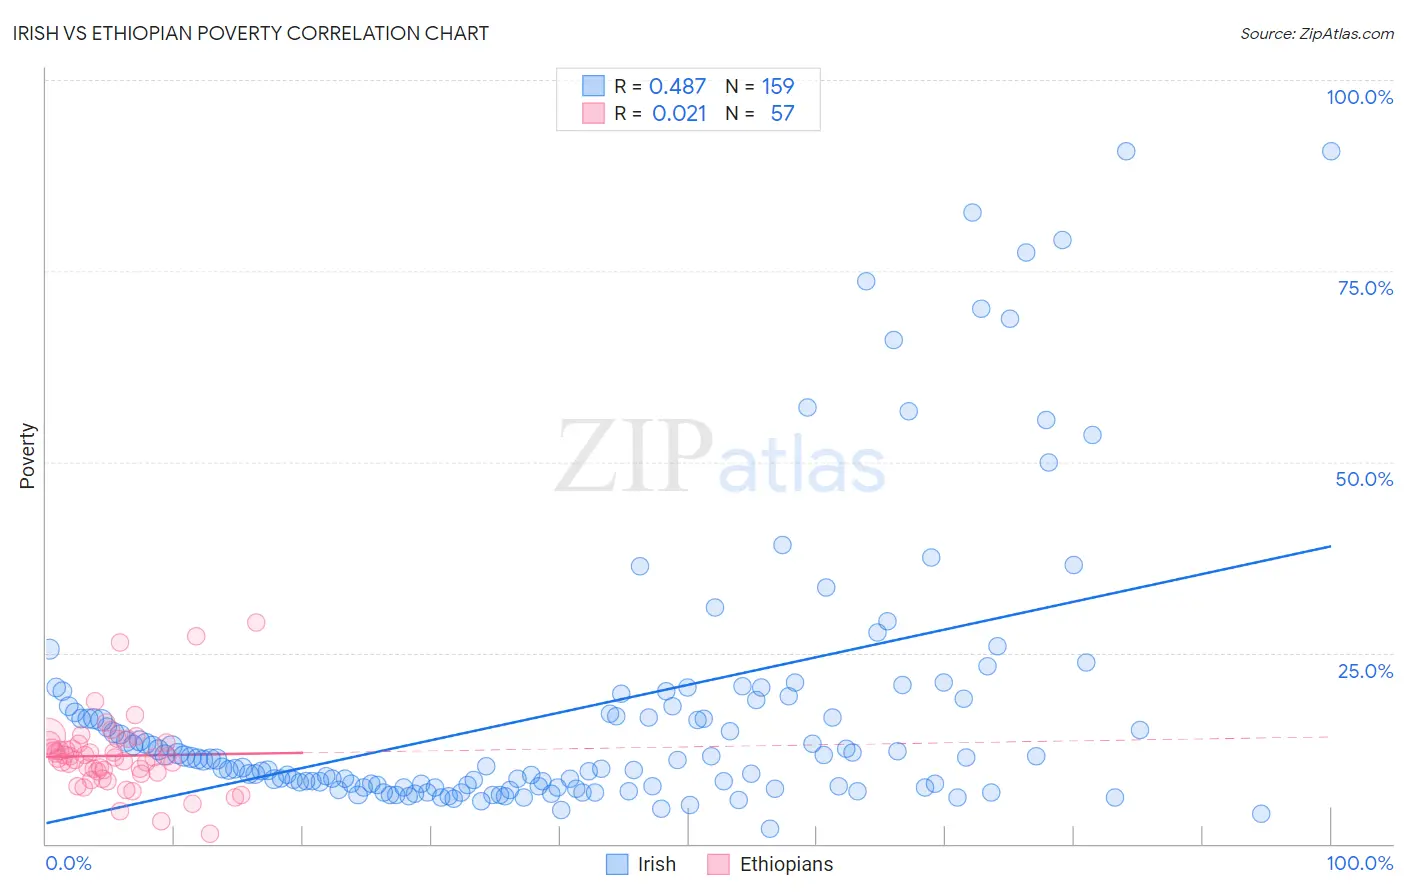
Irish vs Ethiopian Poverty Correlation Chart
The statistical analysis conducted on geographies consisting of 579,456,030 people shows a moderate positive correlation between the proportion of Irish and poverty level in the United States with a correlation coefficient (R) of 0.487 and weighted average of 11.3%. Similarly, the statistical analysis conducted on geographies consisting of 223,124,419 people shows no correlation between the proportion of Ethiopians and poverty level in the United States with a correlation coefficient (R) of 0.021 and weighted average of 12.2%, a difference of 7.9%.
Poverty Correlation Summary
| Measurement | Irish | Ethiopian |
| Minimum | 2.0% | 1.3% |
| Maximum | 90.7% | 28.9% |
| Range | 88.7% | 27.7% |
| Mean | 17.4% | 11.5% |
| Median | 11.0% | 11.3% |
| Interquartile 25% (IQ1) | 7.5% | 9.2% |
| Interquartile 75% (IQ3) | 18.1% | 13.1% |
| Interquartile Range (IQR) | 10.6% | 3.9% |
| Standard Deviation (Sample) | 18.1% | 5.0% |
| Standard Deviation (Population) | 18.0% | 4.9% |
Similar Demographics by Poverty
Demographics Similar to Irish by Poverty
In terms of poverty, the demographic groups most similar to Irish are Indian (Asian) (11.3%, a difference of 0.0%), Cambodian (11.3%, a difference of 0.020%), Dutch (11.3%, a difference of 0.070%), Immigrants from Eastern Asia (11.3%, a difference of 0.080%), and Egyptian (11.3%, a difference of 0.090%).
| Demographics | Rating | Rank | Poverty |
| Carpatho Rusyns | 97.2 /100 | #74 | Exceptional 11.3% |
| Immigrants | Eastern Europe | 97.0 /100 | #75 | Exceptional 11.3% |
| Immigrants | North America | 96.8 /100 | #76 | Exceptional 11.3% |
| Immigrants | Eastern Asia | 96.7 /100 | #77 | Exceptional 11.3% |
| Dutch | 96.7 /100 | #78 | Exceptional 11.3% |
| Cambodians | 96.7 /100 | #79 | Exceptional 11.3% |
| Indians (Asian) | 96.6 /100 | #80 | Exceptional 11.3% |
| Irish | 96.6 /100 | #81 | Exceptional 11.3% |
| Egyptians | 96.5 /100 | #82 | Exceptional 11.3% |
| Immigrants | Sweden | 96.3 /100 | #83 | Exceptional 11.3% |
| English | 96.3 /100 | #84 | Exceptional 11.3% |
| Immigrants | England | 96.2 /100 | #85 | Exceptional 11.4% |
| Jordanians | 96.0 /100 | #86 | Exceptional 11.4% |
| Northern Europeans | 96.0 /100 | #87 | Exceptional 11.4% |
| Belgians | 95.8 /100 | #88 | Exceptional 11.4% |
Demographics Similar to Ethiopians by Poverty
In terms of poverty, the demographic groups most similar to Ethiopians are Immigrants from Fiji (12.2%, a difference of 0.010%), Immigrants from Ethiopia (12.2%, a difference of 0.050%), Colombian (12.2%, a difference of 0.12%), Immigrants from Nepal (12.2%, a difference of 0.13%), and Immigrants from Albania (12.2%, a difference of 0.13%).
| Demographics | Rating | Rank | Poverty |
| Hungarians | 63.6 /100 | #155 | Good 12.2% |
| Scotch-Irish | 62.6 /100 | #156 | Good 12.2% |
| Costa Ricans | 62.2 /100 | #157 | Good 12.2% |
| Taiwanese | 61.8 /100 | #158 | Good 12.2% |
| Pennsylvania Germans | 60.8 /100 | #159 | Good 12.2% |
| Immigrants | Nepal | 60.4 /100 | #160 | Good 12.2% |
| Immigrants | Fiji | 59.1 /100 | #161 | Average 12.2% |
| Ethiopians | 59.1 /100 | #162 | Average 12.2% |
| Immigrants | Ethiopia | 58.6 /100 | #163 | Average 12.2% |
| Colombians | 57.8 /100 | #164 | Average 12.2% |
| Immigrants | Albania | 57.7 /100 | #165 | Average 12.2% |
| Venezuelans | 56.9 /100 | #166 | Average 12.2% |
| Immigrants | Chile | 56.7 /100 | #167 | Average 12.2% |
| Immigrants | Venezuela | 56.5 /100 | #168 | Average 12.2% |
| Whites/Caucasians | 55.4 /100 | #169 | Average 12.3% |