Irish vs Menominee Single Mother Poverty
COMPARE
Irish
Menominee
Single Mother Poverty
Single Mother Poverty Comparison
Irish
Menominee
29.8%
SINGLE MOTHER POVERTY
13.9/ 100
METRIC RATING
209th/ 347
METRIC RANK
37.1%
SINGLE MOTHER POVERTY
0.0/ 100
METRIC RATING
333rd/ 347
METRIC RANK
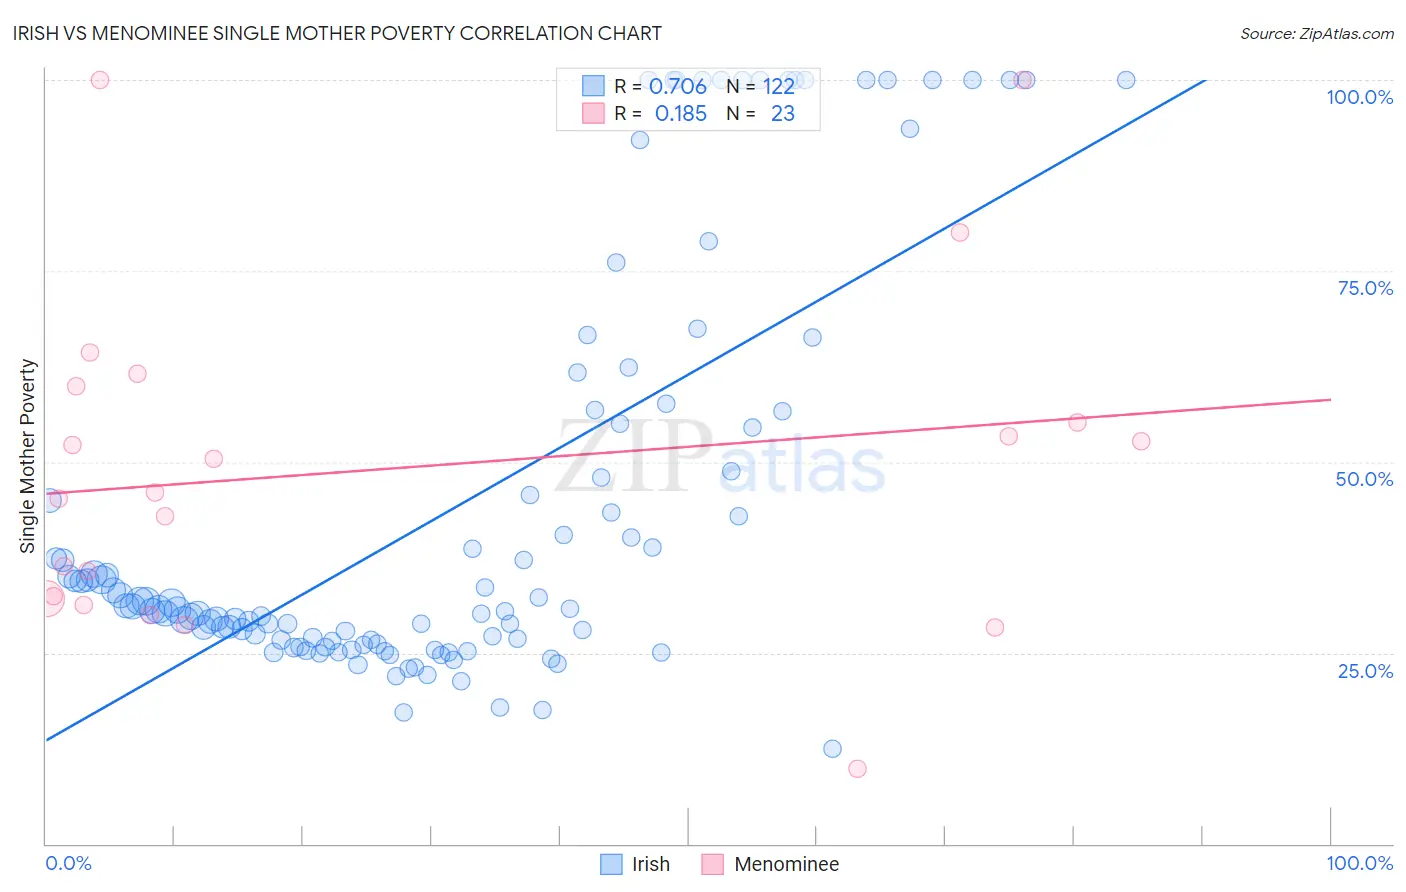
Irish vs Menominee Single Mother Poverty Correlation Chart
The statistical analysis conducted on geographies consisting of 549,467,184 people shows a strong positive correlation between the proportion of Irish and poverty level among single mothers in the United States with a correlation coefficient (R) of 0.706 and weighted average of 29.8%. Similarly, the statistical analysis conducted on geographies consisting of 45,498,385 people shows a poor positive correlation between the proportion of Menominee and poverty level among single mothers in the United States with a correlation coefficient (R) of 0.185 and weighted average of 37.1%, a difference of 24.3%.
Single Mother Poverty Correlation Summary
| Measurement | Irish | Menominee |
| Minimum | 12.4% | 9.8% |
| Maximum | 100.0% | 100.0% |
| Range | 87.6% | 90.2% |
| Mean | 43.8% | 49.1% |
| Median | 30.8% | 46.0% |
| Interquartile 25% (IQ1) | 26.6% | 32.1% |
| Interquartile 75% (IQ3) | 54.5% | 59.9% |
| Interquartile Range (IQR) | 28.0% | 27.8% |
| Standard Deviation (Sample) | 26.6% | 22.1% |
| Standard Deviation (Population) | 26.5% | 21.6% |
Similar Demographics by Single Mother Poverty
Demographics Similar to Irish by Single Mother Poverty
In terms of single mother poverty, the demographic groups most similar to Irish are Haitian (29.8%, a difference of 0.060%), Immigrants from Guyana (29.8%, a difference of 0.080%), Guyanese (29.8%, a difference of 0.11%), Immigrants from Panama (29.8%, a difference of 0.15%), and Nicaraguan (29.8%, a difference of 0.15%).
| Demographics | Rating | Rank | Single Mother Poverty |
| Malaysians | 17.4 /100 | #202 | Poor 29.7% |
| Swiss | 17.2 /100 | #203 | Poor 29.7% |
| Immigrants | Immigrants | 16.6 /100 | #204 | Poor 29.7% |
| Czechoslovakians | 16.1 /100 | #205 | Poor 29.7% |
| Immigrants | Haiti | 15.8 /100 | #206 | Poor 29.7% |
| Immigrants | Panama | 15.5 /100 | #207 | Poor 29.8% |
| Immigrants | Guyana | 14.7 /100 | #208 | Poor 29.8% |
| Irish | 13.9 /100 | #209 | Poor 29.8% |
| Haitians | 13.3 /100 | #210 | Poor 29.8% |
| Guyanese | 12.8 /100 | #211 | Poor 29.8% |
| Nicaraguans | 12.4 /100 | #212 | Poor 29.8% |
| Immigrants | Thailand | 12.0 /100 | #213 | Poor 29.9% |
| Liberians | 11.7 /100 | #214 | Poor 29.9% |
| Jamaicans | 11.7 /100 | #215 | Poor 29.9% |
| Immigrants | Western Africa | 11.5 /100 | #216 | Poor 29.9% |
Demographics Similar to Menominee by Single Mother Poverty
In terms of single mother poverty, the demographic groups most similar to Menominee are Pueblo (37.2%, a difference of 0.37%), Dutch West Indian (36.8%, a difference of 0.78%), Creek (36.7%, a difference of 1.0%), Native/Alaskan (36.6%, a difference of 1.2%), and Apache (36.6%, a difference of 1.3%).
| Demographics | Rating | Rank | Single Mother Poverty |
| Seminole | 0.0 /100 | #326 | Tragic 35.8% |
| Yakama | 0.0 /100 | #327 | Tragic 36.4% |
| Choctaw | 0.0 /100 | #328 | Tragic 36.4% |
| Apache | 0.0 /100 | #329 | Tragic 36.6% |
| Natives/Alaskans | 0.0 /100 | #330 | Tragic 36.6% |
| Creek | 0.0 /100 | #331 | Tragic 36.7% |
| Dutch West Indians | 0.0 /100 | #332 | Tragic 36.8% |
| Menominee | 0.0 /100 | #333 | Tragic 37.1% |
| Pueblo | 0.0 /100 | #334 | Tragic 37.2% |
| Yuman | 0.0 /100 | #335 | Tragic 37.8% |
| Cheyenne | 0.0 /100 | #336 | Tragic 38.5% |
| Immigrants | Yemen | 0.0 /100 | #337 | Tragic 38.5% |
| Pima | 0.0 /100 | #338 | Tragic 38.6% |
| Crow | 0.0 /100 | #339 | Tragic 38.6% |
| Sioux | 0.0 /100 | #340 | Tragic 38.8% |