Irish vs Ugandan Single Mother Poverty
COMPARE
Irish
Ugandan
Single Mother Poverty
Single Mother Poverty Comparison
Irish
Ugandans
29.8%
SINGLE MOTHER POVERTY
13.9/ 100
METRIC RATING
209th/ 347
METRIC RANK
28.8%
SINGLE MOTHER POVERTY
71.7/ 100
METRIC RATING
155th/ 347
METRIC RANK
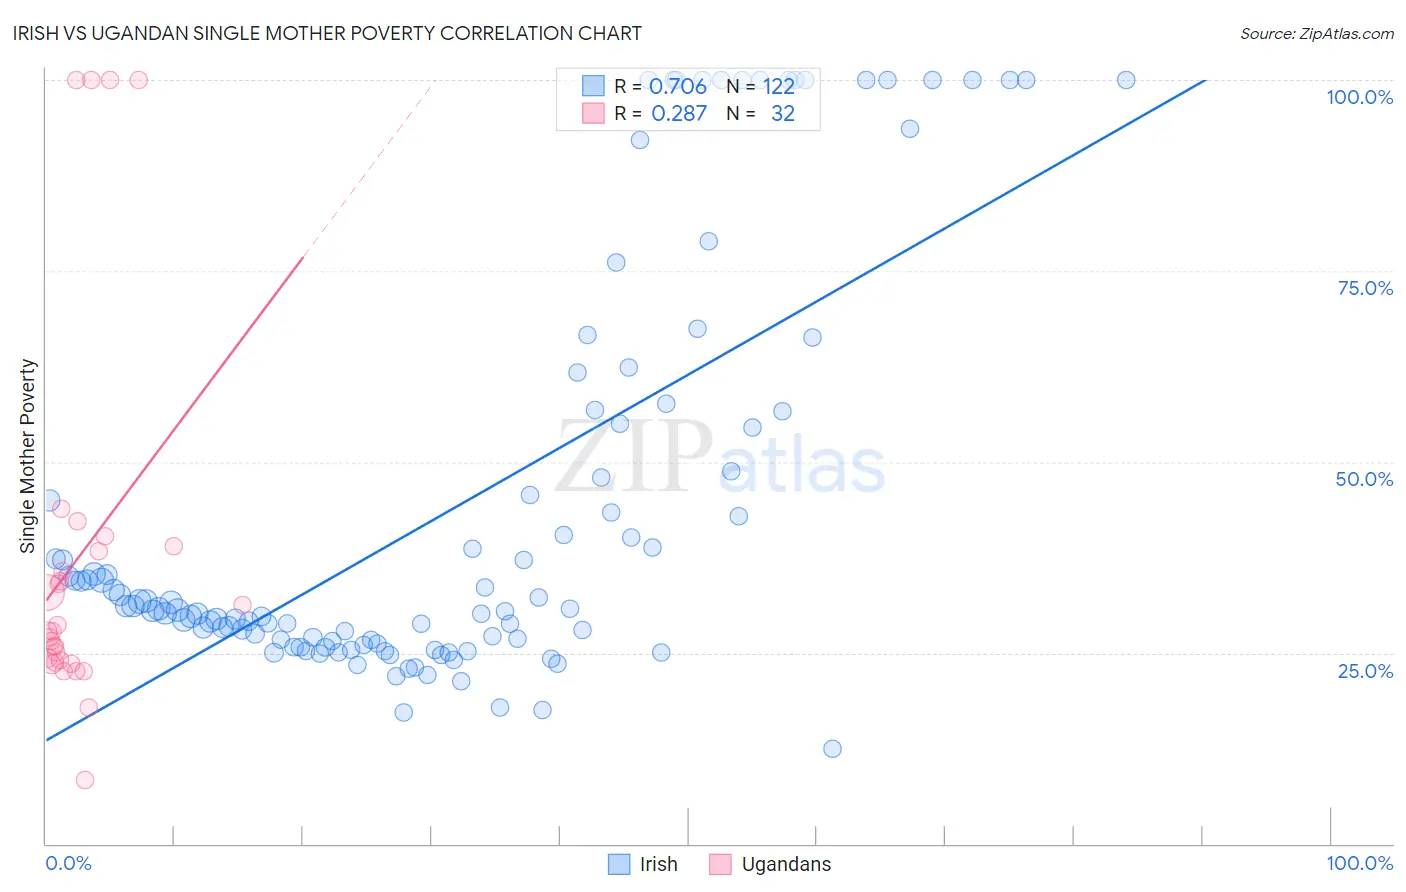
Irish vs Ugandan Single Mother Poverty Correlation Chart
The statistical analysis conducted on geographies consisting of 549,467,184 people shows a strong positive correlation between the proportion of Irish and poverty level among single mothers in the United States with a correlation coefficient (R) of 0.706 and weighted average of 29.8%. Similarly, the statistical analysis conducted on geographies consisting of 93,563,959 people shows a weak positive correlation between the proportion of Ugandans and poverty level among single mothers in the United States with a correlation coefficient (R) of 0.287 and weighted average of 28.8%, a difference of 3.3%.
Single Mother Poverty Correlation Summary
| Measurement | Irish | Ugandan |
| Minimum | 12.4% | 8.4% |
| Maximum | 100.0% | 100.0% |
| Range | 87.6% | 91.6% |
| Mean | 43.8% | 37.5% |
| Median | 30.8% | 27.8% |
| Interquartile 25% (IQ1) | 26.6% | 23.9% |
| Interquartile 75% (IQ3) | 54.5% | 38.6% |
| Interquartile Range (IQR) | 28.0% | 14.7% |
| Standard Deviation (Sample) | 26.6% | 25.1% |
| Standard Deviation (Population) | 26.5% | 24.7% |
Similar Demographics by Single Mother Poverty
Demographics Similar to Irish by Single Mother Poverty
In terms of single mother poverty, the demographic groups most similar to Irish are Haitian (29.8%, a difference of 0.060%), Immigrants from Guyana (29.8%, a difference of 0.080%), Guyanese (29.8%, a difference of 0.11%), Immigrants from Panama (29.8%, a difference of 0.15%), and Nicaraguan (29.8%, a difference of 0.15%).
| Demographics | Rating | Rank | Single Mother Poverty |
| Malaysians | 17.4 /100 | #202 | Poor 29.7% |
| Swiss | 17.2 /100 | #203 | Poor 29.7% |
| Immigrants | Immigrants | 16.6 /100 | #204 | Poor 29.7% |
| Czechoslovakians | 16.1 /100 | #205 | Poor 29.7% |
| Immigrants | Haiti | 15.8 /100 | #206 | Poor 29.7% |
| Immigrants | Panama | 15.5 /100 | #207 | Poor 29.8% |
| Immigrants | Guyana | 14.7 /100 | #208 | Poor 29.8% |
| Irish | 13.9 /100 | #209 | Poor 29.8% |
| Haitians | 13.3 /100 | #210 | Poor 29.8% |
| Guyanese | 12.8 /100 | #211 | Poor 29.8% |
| Nicaraguans | 12.4 /100 | #212 | Poor 29.8% |
| Immigrants | Thailand | 12.0 /100 | #213 | Poor 29.9% |
| Liberians | 11.7 /100 | #214 | Poor 29.9% |
| Jamaicans | 11.7 /100 | #215 | Poor 29.9% |
| Immigrants | Western Africa | 11.5 /100 | #216 | Poor 29.9% |
Demographics Similar to Ugandans by Single Mother Poverty
In terms of single mother poverty, the demographic groups most similar to Ugandans are Iraqi (28.8%, a difference of 0.010%), Immigrants from Western Europe (28.9%, a difference of 0.040%), Immigrants from Hungary (28.9%, a difference of 0.070%), Portuguese (28.8%, a difference of 0.090%), and Czech (28.9%, a difference of 0.19%).
| Demographics | Rating | Rank | Single Mother Poverty |
| Syrians | 85.3 /100 | #148 | Excellent 28.6% |
| Serbians | 85.0 /100 | #149 | Excellent 28.6% |
| Northern Europeans | 81.7 /100 | #150 | Excellent 28.6% |
| Immigrants | Oceania | 79.9 /100 | #151 | Good 28.7% |
| Austrians | 79.0 /100 | #152 | Good 28.7% |
| Slovenes | 76.4 /100 | #153 | Good 28.8% |
| Portuguese | 73.2 /100 | #154 | Good 28.8% |
| Ugandans | 71.7 /100 | #155 | Good 28.8% |
| Iraqis | 71.5 /100 | #156 | Good 28.8% |
| Immigrants | Western Europe | 71.1 /100 | #157 | Good 28.9% |
| Immigrants | Hungary | 70.6 /100 | #158 | Good 28.9% |
| Czechs | 68.4 /100 | #159 | Good 28.9% |
| Japanese | 68.0 /100 | #160 | Good 28.9% |
| Immigrants | Cambodia | 66.6 /100 | #161 | Good 28.9% |
| Scandinavians | 66.2 /100 | #162 | Good 28.9% |