Irish vs Lithuanian Single Mother Poverty
COMPARE
Irish
Lithuanian
Single Mother Poverty
Single Mother Poverty Comparison
Irish
Lithuanians
29.8%
SINGLE MOTHER POVERTY
13.9/ 100
METRIC RATING
209th/ 347
METRIC RANK
27.4%
SINGLE MOTHER POVERTY
99.4/ 100
METRIC RATING
69th/ 347
METRIC RANK
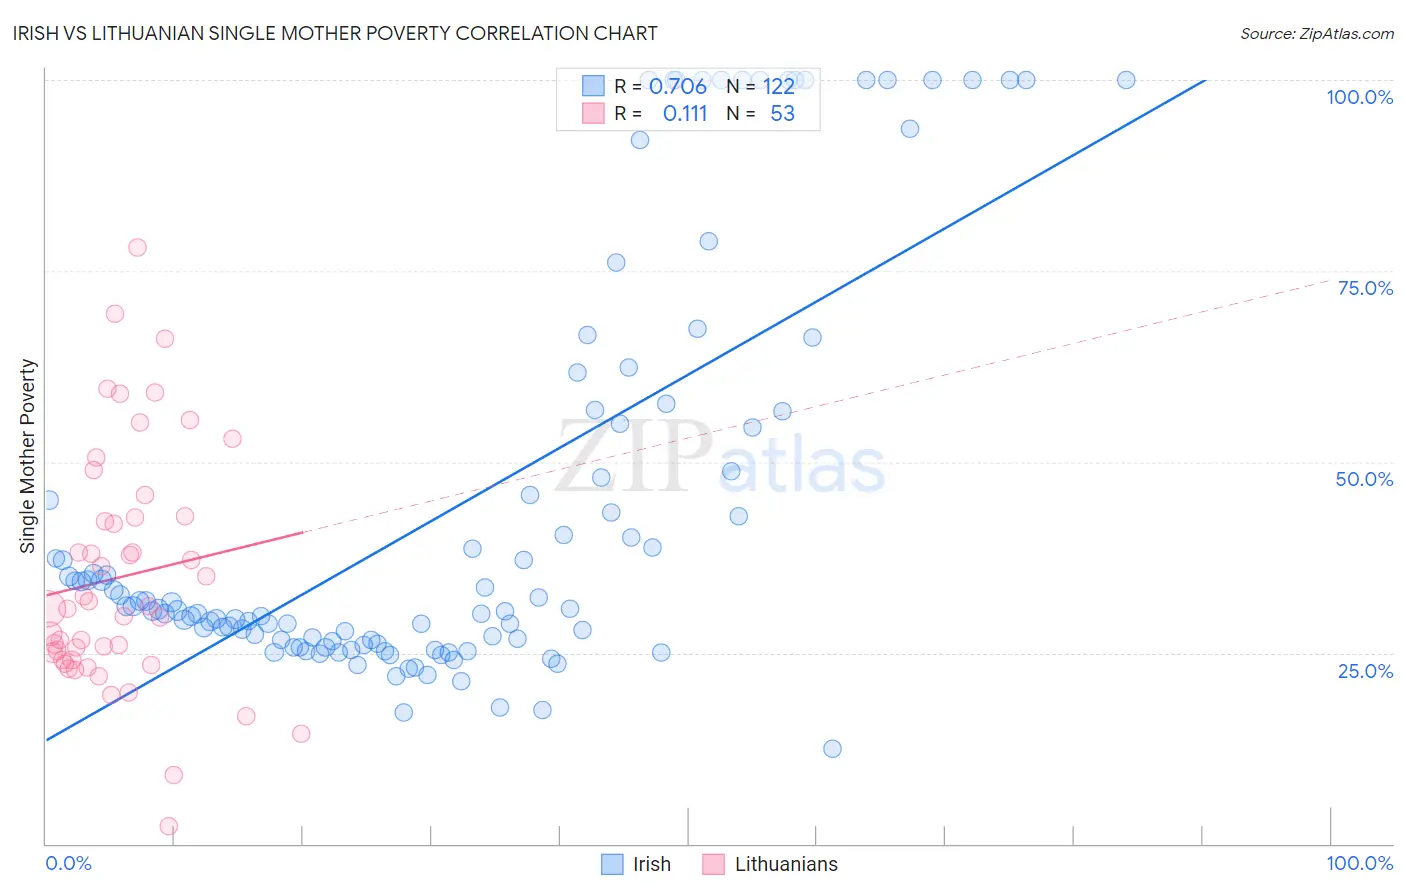
Irish vs Lithuanian Single Mother Poverty Correlation Chart
The statistical analysis conducted on geographies consisting of 549,467,184 people shows a strong positive correlation between the proportion of Irish and poverty level among single mothers in the United States with a correlation coefficient (R) of 0.706 and weighted average of 29.8%. Similarly, the statistical analysis conducted on geographies consisting of 407,174,767 people shows a poor positive correlation between the proportion of Lithuanians and poverty level among single mothers in the United States with a correlation coefficient (R) of 0.111 and weighted average of 27.4%, a difference of 8.8%.
Single Mother Poverty Correlation Summary
| Measurement | Irish | Lithuanian |
| Minimum | 12.4% | 2.2% |
| Maximum | 100.0% | 78.1% |
| Range | 87.6% | 75.9% |
| Mean | 43.8% | 34.9% |
| Median | 30.8% | 30.8% |
| Interquartile 25% (IQ1) | 26.6% | 24.1% |
| Interquartile 75% (IQ3) | 54.5% | 42.8% |
| Interquartile Range (IQR) | 28.0% | 18.7% |
| Standard Deviation (Sample) | 26.6% | 15.6% |
| Standard Deviation (Population) | 26.5% | 15.5% |
Similar Demographics by Single Mother Poverty
Demographics Similar to Irish by Single Mother Poverty
In terms of single mother poverty, the demographic groups most similar to Irish are Haitian (29.8%, a difference of 0.060%), Immigrants from Guyana (29.8%, a difference of 0.080%), Guyanese (29.8%, a difference of 0.11%), Immigrants from Panama (29.8%, a difference of 0.15%), and Nicaraguan (29.8%, a difference of 0.15%).
| Demographics | Rating | Rank | Single Mother Poverty |
| Malaysians | 17.4 /100 | #202 | Poor 29.7% |
| Swiss | 17.2 /100 | #203 | Poor 29.7% |
| Immigrants | Immigrants | 16.6 /100 | #204 | Poor 29.7% |
| Czechoslovakians | 16.1 /100 | #205 | Poor 29.7% |
| Immigrants | Haiti | 15.8 /100 | #206 | Poor 29.7% |
| Immigrants | Panama | 15.5 /100 | #207 | Poor 29.8% |
| Immigrants | Guyana | 14.7 /100 | #208 | Poor 29.8% |
| Irish | 13.9 /100 | #209 | Poor 29.8% |
| Haitians | 13.3 /100 | #210 | Poor 29.8% |
| Guyanese | 12.8 /100 | #211 | Poor 29.8% |
| Nicaraguans | 12.4 /100 | #212 | Poor 29.8% |
| Immigrants | Thailand | 12.0 /100 | #213 | Poor 29.9% |
| Liberians | 11.7 /100 | #214 | Poor 29.9% |
| Jamaicans | 11.7 /100 | #215 | Poor 29.9% |
| Immigrants | Western Africa | 11.5 /100 | #216 | Poor 29.9% |
Demographics Similar to Lithuanians by Single Mother Poverty
In terms of single mother poverty, the demographic groups most similar to Lithuanians are Immigrants from Belarus (27.4%, a difference of 0.010%), Macedonian (27.4%, a difference of 0.030%), Immigrants from Russia (27.4%, a difference of 0.060%), Sierra Leonean (27.4%, a difference of 0.12%), and Immigrants from Czechoslovakia (27.4%, a difference of 0.16%).
| Demographics | Rating | Rank | Single Mother Poverty |
| Immigrants | Malaysia | 99.5 /100 | #62 | Exceptional 27.3% |
| Immigrants | Northern Europe | 99.5 /100 | #63 | Exceptional 27.3% |
| Russians | 99.5 /100 | #64 | Exceptional 27.3% |
| Immigrants | Turkey | 99.5 /100 | #65 | Exceptional 27.3% |
| Soviet Union | 99.5 /100 | #66 | Exceptional 27.3% |
| Immigrants | Australia | 99.5 /100 | #67 | Exceptional 27.3% |
| Immigrants | Czechoslovakia | 99.5 /100 | #68 | Exceptional 27.4% |
| Lithuanians | 99.4 /100 | #69 | Exceptional 27.4% |
| Immigrants | Belarus | 99.4 /100 | #70 | Exceptional 27.4% |
| Macedonians | 99.4 /100 | #71 | Exceptional 27.4% |
| Immigrants | Russia | 99.4 /100 | #72 | Exceptional 27.4% |
| Sierra Leoneans | 99.3 /100 | #73 | Exceptional 27.4% |
| Immigrants | Europe | 99.3 /100 | #74 | Exceptional 27.4% |
| Immigrants | Sweden | 99.2 /100 | #75 | Exceptional 27.5% |
| Peruvians | 99.2 /100 | #76 | Exceptional 27.5% |