Irish vs Alaska Native Single Mother Poverty
COMPARE
Irish
Alaska Native
Single Mother Poverty
Single Mother Poverty Comparison
Irish
Alaska Natives
29.8%
SINGLE MOTHER POVERTY
13.9/ 100
METRIC RATING
209th/ 347
METRIC RANK
30.9%
SINGLE MOTHER POVERTY
0.6/ 100
METRIC RATING
252nd/ 347
METRIC RANK
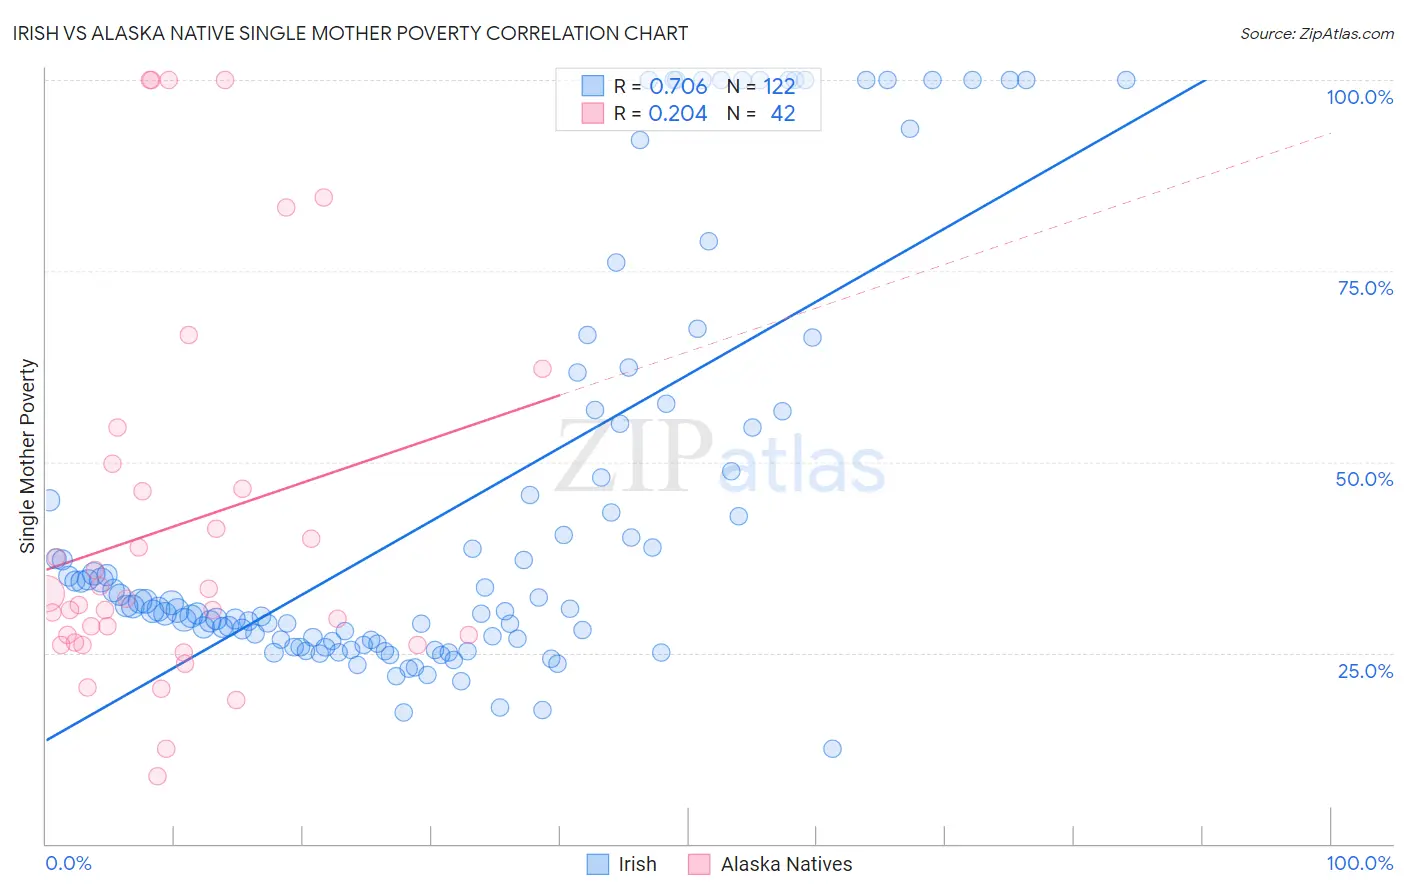
Irish vs Alaska Native Single Mother Poverty Correlation Chart
The statistical analysis conducted on geographies consisting of 549,467,184 people shows a strong positive correlation between the proportion of Irish and poverty level among single mothers in the United States with a correlation coefficient (R) of 0.706 and weighted average of 29.8%. Similarly, the statistical analysis conducted on geographies consisting of 76,488,214 people shows a weak positive correlation between the proportion of Alaska Natives and poverty level among single mothers in the United States with a correlation coefficient (R) of 0.204 and weighted average of 30.9%, a difference of 3.8%.
Single Mother Poverty Correlation Summary
| Measurement | Irish | Alaska Native |
| Minimum | 12.4% | 8.8% |
| Maximum | 100.0% | 100.0% |
| Range | 87.6% | 91.2% |
| Mean | 43.8% | 41.6% |
| Median | 30.8% | 31.7% |
| Interquartile 25% (IQ1) | 26.6% | 26.3% |
| Interquartile 75% (IQ3) | 54.5% | 46.5% |
| Interquartile Range (IQR) | 28.0% | 20.2% |
| Standard Deviation (Sample) | 26.6% | 24.9% |
| Standard Deviation (Population) | 26.5% | 24.6% |
Similar Demographics by Single Mother Poverty
Demographics Similar to Irish by Single Mother Poverty
In terms of single mother poverty, the demographic groups most similar to Irish are Haitian (29.8%, a difference of 0.060%), Immigrants from Guyana (29.8%, a difference of 0.080%), Guyanese (29.8%, a difference of 0.11%), Immigrants from Panama (29.8%, a difference of 0.15%), and Nicaraguan (29.8%, a difference of 0.15%).
| Demographics | Rating | Rank | Single Mother Poverty |
| Malaysians | 17.4 /100 | #202 | Poor 29.7% |
| Swiss | 17.2 /100 | #203 | Poor 29.7% |
| Immigrants | Immigrants | 16.6 /100 | #204 | Poor 29.7% |
| Czechoslovakians | 16.1 /100 | #205 | Poor 29.7% |
| Immigrants | Haiti | 15.8 /100 | #206 | Poor 29.7% |
| Immigrants | Panama | 15.5 /100 | #207 | Poor 29.8% |
| Immigrants | Guyana | 14.7 /100 | #208 | Poor 29.8% |
| Irish | 13.9 /100 | #209 | Poor 29.8% |
| Haitians | 13.3 /100 | #210 | Poor 29.8% |
| Guyanese | 12.8 /100 | #211 | Poor 29.8% |
| Nicaraguans | 12.4 /100 | #212 | Poor 29.8% |
| Immigrants | Thailand | 12.0 /100 | #213 | Poor 29.9% |
| Liberians | 11.7 /100 | #214 | Poor 29.9% |
| Jamaicans | 11.7 /100 | #215 | Poor 29.9% |
| Immigrants | Western Africa | 11.5 /100 | #216 | Poor 29.9% |
Demographics Similar to Alaska Natives by Single Mother Poverty
In terms of single mother poverty, the demographic groups most similar to Alaska Natives are Tlingit-Haida (30.9%, a difference of 0.010%), Celtic (30.9%, a difference of 0.030%), Vietnamese (30.9%, a difference of 0.13%), Senegalese (31.0%, a difference of 0.18%), and Cape Verdean (30.8%, a difference of 0.28%).
| Demographics | Rating | Rank | Single Mother Poverty |
| Barbadians | 1.3 /100 | #245 | Tragic 30.7% |
| Ecuadorians | 0.9 /100 | #246 | Tragic 30.8% |
| West Indians | 0.9 /100 | #247 | Tragic 30.8% |
| French Canadians | 0.9 /100 | #248 | Tragic 30.8% |
| Cape Verdeans | 0.8 /100 | #249 | Tragic 30.8% |
| Vietnamese | 0.7 /100 | #250 | Tragic 30.9% |
| Tlingit-Haida | 0.6 /100 | #251 | Tragic 30.9% |
| Alaska Natives | 0.6 /100 | #252 | Tragic 30.9% |
| Celtics | 0.6 /100 | #253 | Tragic 30.9% |
| Senegalese | 0.5 /100 | #254 | Tragic 31.0% |
| Belizeans | 0.5 /100 | #255 | Tragic 31.0% |
| Immigrants | West Indies | 0.4 /100 | #256 | Tragic 31.1% |
| Immigrants | Bahamas | 0.4 /100 | #257 | Tragic 31.1% |
| Immigrants | Caribbean | 0.4 /100 | #258 | Tragic 31.1% |
| Immigrants | Bangladesh | 0.4 /100 | #259 | Tragic 31.1% |