Iraqi vs West Indian Poverty
COMPARE
Iraqi
West Indian
Poverty
Poverty Comparison
Iraqis
West Indians
12.7%
POVERTY
20.8/ 100
METRIC RATING
196th/ 347
METRIC RANK
15.0%
POVERTY
0.0/ 100
METRIC RATING
284th/ 347
METRIC RANK
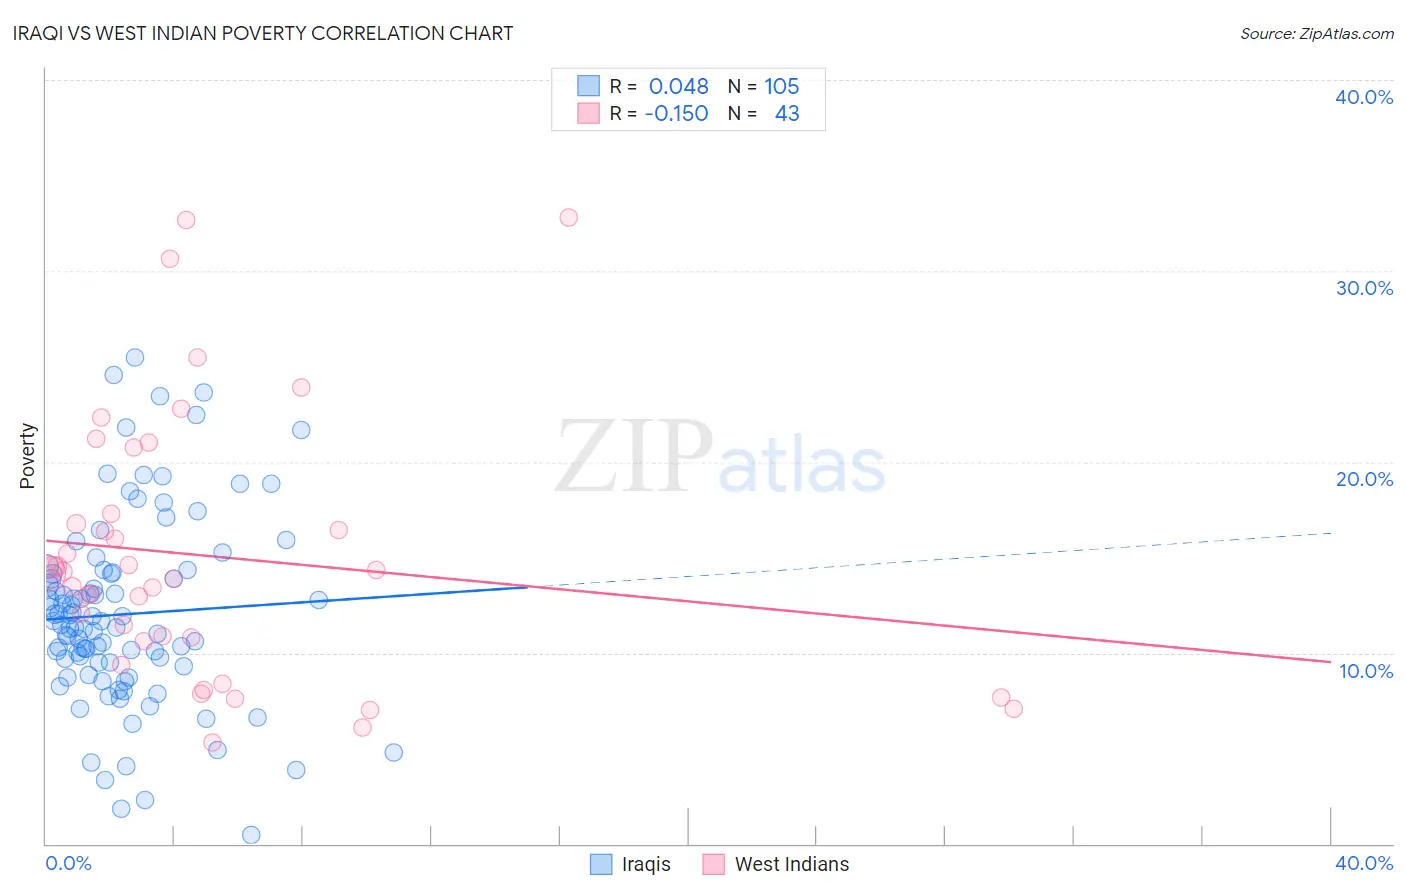
Iraqi vs West Indian Poverty Correlation Chart
The statistical analysis conducted on geographies consisting of 170,596,700 people shows no correlation between the proportion of Iraqis and poverty level in the United States with a correlation coefficient (R) of 0.048 and weighted average of 12.7%. Similarly, the statistical analysis conducted on geographies consisting of 253,897,912 people shows a poor negative correlation between the proportion of West Indians and poverty level in the United States with a correlation coefficient (R) of -0.150 and weighted average of 15.0%, a difference of 17.8%.
Poverty Correlation Summary
| Measurement | Iraqi | West Indian |
| Minimum | 0.47% | 5.3% |
| Maximum | 25.4% | 32.8% |
| Range | 25.0% | 27.5% |
| Mean | 12.0% | 15.1% |
| Median | 11.5% | 14.1% |
| Interquartile 25% (IQ1) | 9.4% | 10.6% |
| Interquartile 75% (IQ3) | 14.2% | 17.3% |
| Interquartile Range (IQR) | 4.8% | 6.7% |
| Standard Deviation (Sample) | 4.9% | 6.9% |
| Standard Deviation (Population) | 4.9% | 6.8% |
Similar Demographics by Poverty
Demographics Similar to Iraqis by Poverty
In terms of poverty, the demographic groups most similar to Iraqis are Immigrants from Kuwait (12.7%, a difference of 0.020%), Arab (12.7%, a difference of 0.050%), Delaware (12.7%, a difference of 0.090%), Immigrants from Lebanon (12.8%, a difference of 0.31%), and Spanish (12.8%, a difference of 0.31%).
| Demographics | Rating | Rank | Poverty |
| Aleuts | 33.2 /100 | #189 | Fair 12.5% |
| Immigrants | South America | 32.3 /100 | #190 | Fair 12.5% |
| Sierra Leoneans | 31.5 /100 | #191 | Fair 12.6% |
| South American Indians | 23.3 /100 | #192 | Fair 12.7% |
| Delaware | 21.4 /100 | #193 | Fair 12.7% |
| Arabs | 21.1 /100 | #194 | Fair 12.7% |
| Immigrants | Kuwait | 20.9 /100 | #195 | Fair 12.7% |
| Iraqis | 20.8 /100 | #196 | Fair 12.7% |
| Immigrants | Lebanon | 18.7 /100 | #197 | Poor 12.8% |
| Spanish | 18.7 /100 | #198 | Poor 12.8% |
| Immigrants | Kenya | 17.5 /100 | #199 | Poor 12.8% |
| Spaniards | 16.5 /100 | #200 | Poor 12.8% |
| Immigrants | Uganda | 16.5 /100 | #201 | Poor 12.8% |
| Immigrants | Uruguay | 15.6 /100 | #202 | Poor 12.8% |
| Hmong | 15.0 /100 | #203 | Poor 12.8% |
Demographics Similar to West Indians by Poverty
In terms of poverty, the demographic groups most similar to West Indians are Vietnamese (15.0%, a difference of 0.050%), Immigrants from Haiti (15.0%, a difference of 0.10%), Comanche (15.0%, a difference of 0.23%), Immigrants from Latin America (15.0%, a difference of 0.32%), and Inupiat (15.1%, a difference of 0.53%).
| Demographics | Rating | Rank | Poverty |
| Bangladeshis | 0.0 /100 | #277 | Tragic 14.8% |
| Belizeans | 0.0 /100 | #278 | Tragic 14.8% |
| Immigrants | St. Vincent and the Grenadines | 0.0 /100 | #279 | Tragic 14.9% |
| Haitians | 0.0 /100 | #280 | Tragic 14.9% |
| Immigrants | Barbados | 0.0 /100 | #281 | Tragic 14.9% |
| Comanche | 0.0 /100 | #282 | Tragic 15.0% |
| Immigrants | Haiti | 0.0 /100 | #283 | Tragic 15.0% |
| West Indians | 0.0 /100 | #284 | Tragic 15.0% |
| Vietnamese | 0.0 /100 | #285 | Tragic 15.0% |
| Immigrants | Latin America | 0.0 /100 | #286 | Tragic 15.0% |
| Inupiat | 0.0 /100 | #287 | Tragic 15.1% |
| Yaqui | 0.0 /100 | #288 | Tragic 15.1% |
| Immigrants | Belize | 0.0 /100 | #289 | Tragic 15.1% |
| Mexicans | 0.0 /100 | #290 | Tragic 15.1% |
| Immigrants | Cabo Verde | 0.0 /100 | #291 | Tragic 15.1% |