Iraqi vs Black/African American Poverty
COMPARE
Iraqi
Black/African American
Poverty
Poverty Comparison
Iraqis
Blacks/African Americans
12.7%
POVERTY
20.8/ 100
METRIC RATING
196th/ 347
METRIC RANK
17.3%
POVERTY
0.0/ 100
METRIC RATING
329th/ 347
METRIC RANK
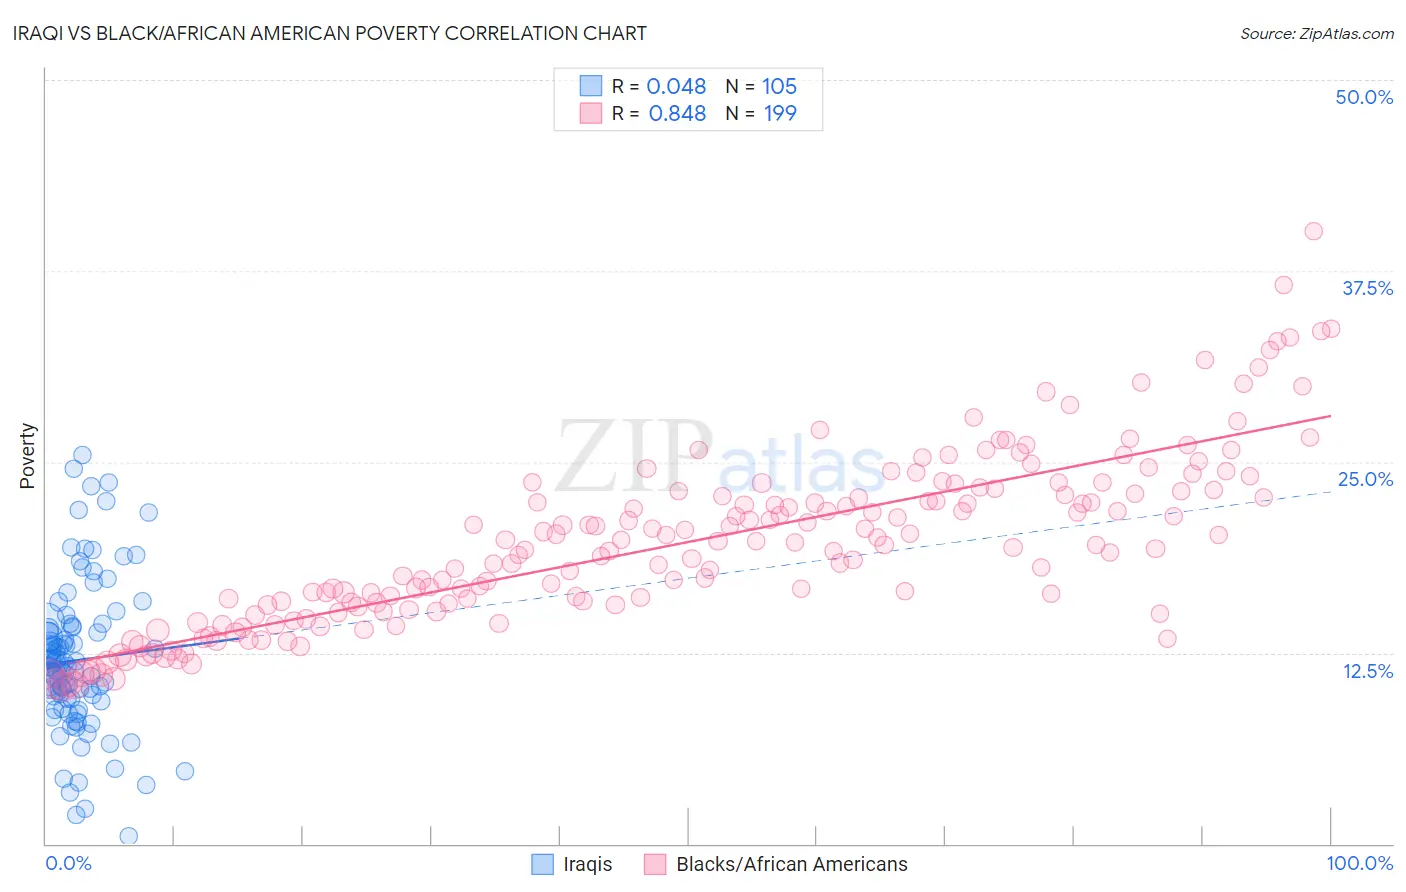
Iraqi vs Black/African American Poverty Correlation Chart
The statistical analysis conducted on geographies consisting of 170,596,700 people shows no correlation between the proportion of Iraqis and poverty level in the United States with a correlation coefficient (R) of 0.048 and weighted average of 12.7%. Similarly, the statistical analysis conducted on geographies consisting of 565,229,178 people shows a very strong positive correlation between the proportion of Blacks/African Americans and poverty level in the United States with a correlation coefficient (R) of 0.848 and weighted average of 17.3%, a difference of 35.6%.
Poverty Correlation Summary
| Measurement | Iraqi | Black/African American |
| Minimum | 0.47% | 10.3% |
| Maximum | 25.4% | 40.1% |
| Range | 25.0% | 29.8% |
| Mean | 12.0% | 19.7% |
| Median | 11.5% | 19.6% |
| Interquartile 25% (IQ1) | 9.4% | 15.7% |
| Interquartile 75% (IQ3) | 14.2% | 23.1% |
| Interquartile Range (IQR) | 4.8% | 7.4% |
| Standard Deviation (Sample) | 4.9% | 5.6% |
| Standard Deviation (Population) | 4.9% | 5.6% |
Similar Demographics by Poverty
Demographics Similar to Iraqis by Poverty
In terms of poverty, the demographic groups most similar to Iraqis are Immigrants from Kuwait (12.7%, a difference of 0.020%), Arab (12.7%, a difference of 0.050%), Delaware (12.7%, a difference of 0.090%), Immigrants from Lebanon (12.8%, a difference of 0.31%), and Spanish (12.8%, a difference of 0.31%).
| Demographics | Rating | Rank | Poverty |
| Aleuts | 33.2 /100 | #189 | Fair 12.5% |
| Immigrants | South America | 32.3 /100 | #190 | Fair 12.5% |
| Sierra Leoneans | 31.5 /100 | #191 | Fair 12.6% |
| South American Indians | 23.3 /100 | #192 | Fair 12.7% |
| Delaware | 21.4 /100 | #193 | Fair 12.7% |
| Arabs | 21.1 /100 | #194 | Fair 12.7% |
| Immigrants | Kuwait | 20.9 /100 | #195 | Fair 12.7% |
| Iraqis | 20.8 /100 | #196 | Fair 12.7% |
| Immigrants | Lebanon | 18.7 /100 | #197 | Poor 12.8% |
| Spanish | 18.7 /100 | #198 | Poor 12.8% |
| Immigrants | Kenya | 17.5 /100 | #199 | Poor 12.8% |
| Spaniards | 16.5 /100 | #200 | Poor 12.8% |
| Immigrants | Uganda | 16.5 /100 | #201 | Poor 12.8% |
| Immigrants | Uruguay | 15.6 /100 | #202 | Poor 12.8% |
| Hmong | 15.0 /100 | #203 | Poor 12.8% |
Demographics Similar to Blacks/African Americans by Poverty
In terms of poverty, the demographic groups most similar to Blacks/African Americans are Ute (16.9%, a difference of 2.0%), Dominican (17.6%, a difference of 2.3%), Kiowa (16.8%, a difference of 2.5%), Paiute (16.7%, a difference of 3.0%), and Immigrants from Dominican Republic (17.8%, a difference of 3.2%).
| Demographics | Rating | Rank | Poverty |
| Menominee | 0.0 /100 | #322 | Tragic 16.4% |
| Colville | 0.0 /100 | #323 | Tragic 16.6% |
| Yakama | 0.0 /100 | #324 | Tragic 16.7% |
| Central American Indians | 0.0 /100 | #325 | Tragic 16.7% |
| Paiute | 0.0 /100 | #326 | Tragic 16.7% |
| Kiowa | 0.0 /100 | #327 | Tragic 16.8% |
| Ute | 0.0 /100 | #328 | Tragic 16.9% |
| Blacks/African Americans | 0.0 /100 | #329 | Tragic 17.3% |
| Dominicans | 0.0 /100 | #330 | Tragic 17.6% |
| Immigrants | Dominican Republic | 0.0 /100 | #331 | Tragic 17.8% |
| Natives/Alaskans | 0.0 /100 | #332 | Tragic 18.1% |
| Houma | 0.0 /100 | #333 | Tragic 18.4% |
| Apache | 0.0 /100 | #334 | Tragic 18.4% |
| Cheyenne | 0.0 /100 | #335 | Tragic 18.9% |
| Pueblo | 0.0 /100 | #336 | Tragic 19.4% |