Iraqi vs Honduran Poverty
COMPARE
Iraqi
Honduran
Poverty
Poverty Comparison
Iraqis
Hondurans
12.7%
POVERTY
20.8/ 100
METRIC RATING
196th/ 347
METRIC RANK
15.9%
POVERTY
0.0/ 100
METRIC RATING
316th/ 347
METRIC RANK
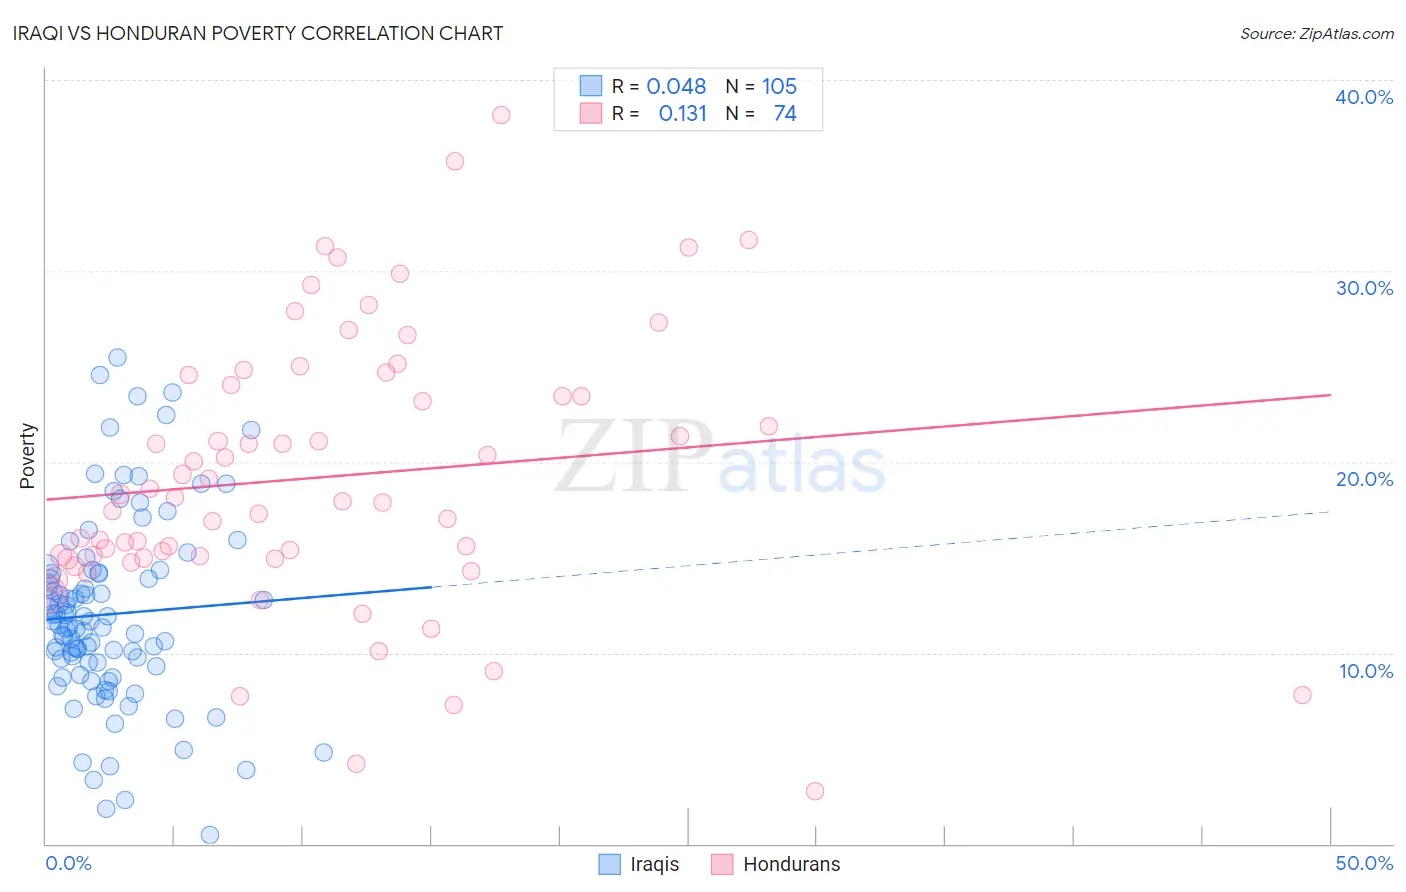
Iraqi vs Honduran Poverty Correlation Chart
The statistical analysis conducted on geographies consisting of 170,596,700 people shows no correlation between the proportion of Iraqis and poverty level in the United States with a correlation coefficient (R) of 0.048 and weighted average of 12.7%. Similarly, the statistical analysis conducted on geographies consisting of 357,599,522 people shows a poor positive correlation between the proportion of Hondurans and poverty level in the United States with a correlation coefficient (R) of 0.131 and weighted average of 15.9%, a difference of 24.7%.
Poverty Correlation Summary
| Measurement | Iraqi | Honduran |
| Minimum | 0.47% | 2.7% |
| Maximum | 25.4% | 38.1% |
| Range | 25.0% | 35.4% |
| Mean | 12.0% | 19.2% |
| Median | 11.5% | 18.0% |
| Interquartile 25% (IQ1) | 9.4% | 15.0% |
| Interquartile 75% (IQ3) | 14.2% | 24.0% |
| Interquartile Range (IQR) | 4.8% | 9.1% |
| Standard Deviation (Sample) | 4.9% | 7.1% |
| Standard Deviation (Population) | 4.9% | 7.0% |
Similar Demographics by Poverty
Demographics Similar to Iraqis by Poverty
In terms of poverty, the demographic groups most similar to Iraqis are Immigrants from Kuwait (12.7%, a difference of 0.020%), Arab (12.7%, a difference of 0.050%), Delaware (12.7%, a difference of 0.090%), Immigrants from Lebanon (12.8%, a difference of 0.31%), and Spanish (12.8%, a difference of 0.31%).
| Demographics | Rating | Rank | Poverty |
| Aleuts | 33.2 /100 | #189 | Fair 12.5% |
| Immigrants | South America | 32.3 /100 | #190 | Fair 12.5% |
| Sierra Leoneans | 31.5 /100 | #191 | Fair 12.6% |
| South American Indians | 23.3 /100 | #192 | Fair 12.7% |
| Delaware | 21.4 /100 | #193 | Fair 12.7% |
| Arabs | 21.1 /100 | #194 | Fair 12.7% |
| Immigrants | Kuwait | 20.9 /100 | #195 | Fair 12.7% |
| Iraqis | 20.8 /100 | #196 | Fair 12.7% |
| Immigrants | Lebanon | 18.7 /100 | #197 | Poor 12.8% |
| Spanish | 18.7 /100 | #198 | Poor 12.8% |
| Immigrants | Kenya | 17.5 /100 | #199 | Poor 12.8% |
| Spaniards | 16.5 /100 | #200 | Poor 12.8% |
| Immigrants | Uganda | 16.5 /100 | #201 | Poor 12.8% |
| Immigrants | Uruguay | 15.6 /100 | #202 | Poor 12.8% |
| Hmong | 15.0 /100 | #203 | Poor 12.8% |
Demographics Similar to Hondurans by Poverty
In terms of poverty, the demographic groups most similar to Hondurans are British West Indian (15.9%, a difference of 0.0%), Immigrants from Somalia (15.8%, a difference of 0.37%), Immigrants from Grenada (15.8%, a difference of 0.49%), Cajun (15.7%, a difference of 0.94%), and Chippewa (15.7%, a difference of 1.1%).
| Demographics | Rating | Rank | Poverty |
| Seminole | 0.0 /100 | #309 | Tragic 15.6% |
| Dutch West Indians | 0.0 /100 | #310 | Tragic 15.6% |
| Chippewa | 0.0 /100 | #311 | Tragic 15.7% |
| Cajuns | 0.0 /100 | #312 | Tragic 15.7% |
| Immigrants | Grenada | 0.0 /100 | #313 | Tragic 15.8% |
| Immigrants | Somalia | 0.0 /100 | #314 | Tragic 15.8% |
| British West Indians | 0.0 /100 | #315 | Tragic 15.9% |
| Hondurans | 0.0 /100 | #316 | Tragic 15.9% |
| U.S. Virgin Islanders | 0.0 /100 | #317 | Tragic 16.1% |
| Immigrants | Dominica | 0.0 /100 | #318 | Tragic 16.1% |
| Immigrants | Congo | 0.0 /100 | #319 | Tragic 16.1% |
| Immigrants | Honduras | 0.0 /100 | #320 | Tragic 16.2% |
| Arapaho | 0.0 /100 | #321 | Tragic 16.3% |
| Menominee | 0.0 /100 | #322 | Tragic 16.4% |
| Colville | 0.0 /100 | #323 | Tragic 16.6% |