Creek vs West Indian Poverty
COMPARE
Creek
West Indian
Poverty
Poverty Comparison
Creek
West Indians
15.6%
POVERTY
0.0/ 100
METRIC RATING
306th/ 347
METRIC RANK
15.0%
POVERTY
0.0/ 100
METRIC RATING
284th/ 347
METRIC RANK
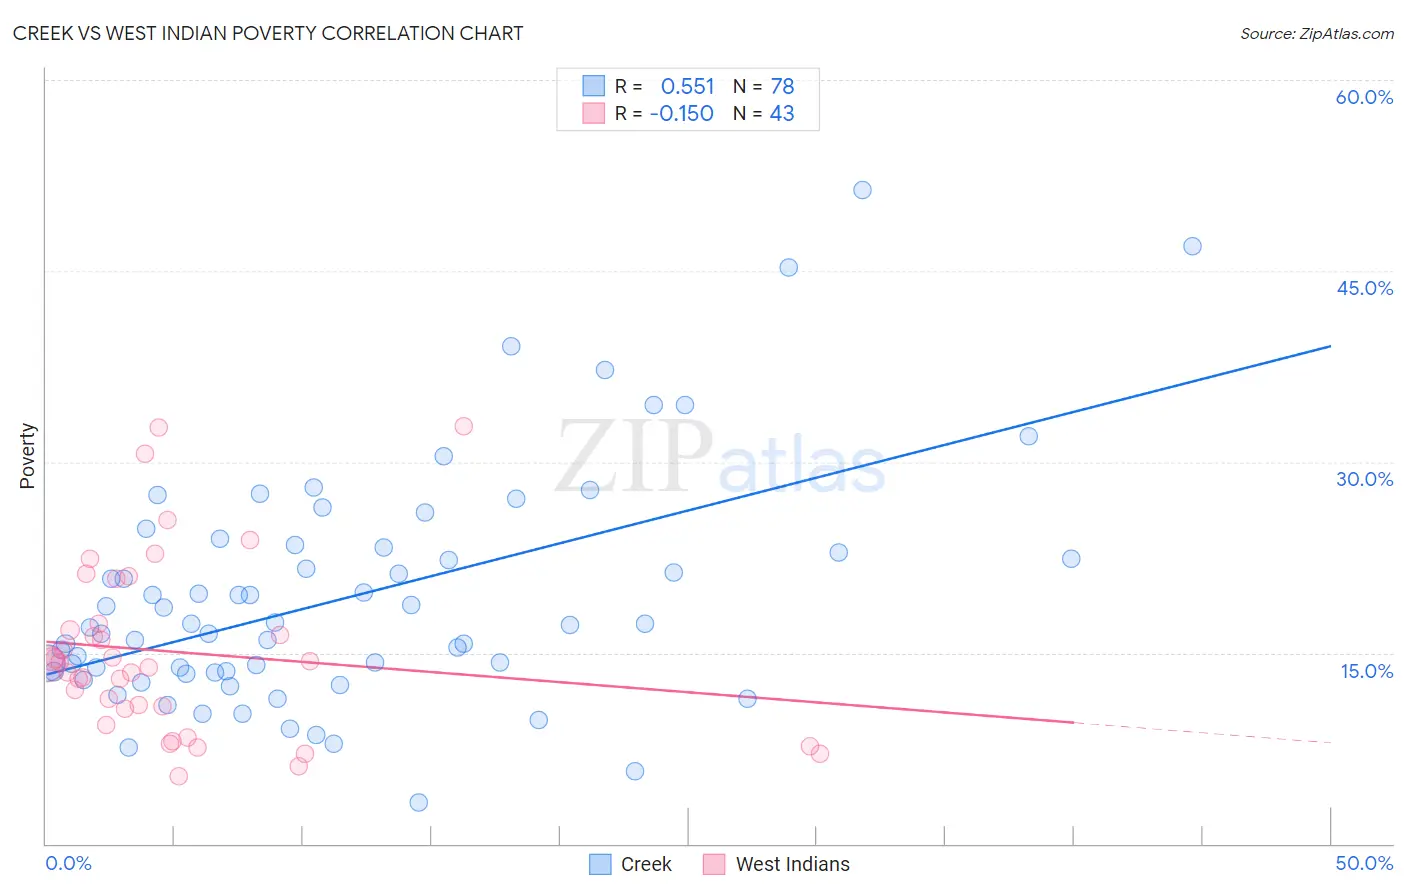
Creek vs West Indian Poverty Correlation Chart
The statistical analysis conducted on geographies consisting of 178,440,498 people shows a substantial positive correlation between the proportion of Creek and poverty level in the United States with a correlation coefficient (R) of 0.551 and weighted average of 15.6%. Similarly, the statistical analysis conducted on geographies consisting of 253,897,912 people shows a poor negative correlation between the proportion of West Indians and poverty level in the United States with a correlation coefficient (R) of -0.150 and weighted average of 15.0%, a difference of 3.9%.
Poverty Correlation Summary
| Measurement | Creek | West Indian |
| Minimum | 3.2% | 5.3% |
| Maximum | 51.4% | 32.8% |
| Range | 48.1% | 27.5% |
| Mean | 19.4% | 15.1% |
| Median | 17.2% | 14.1% |
| Interquartile 25% (IQ1) | 13.5% | 10.6% |
| Interquartile 75% (IQ3) | 23.3% | 17.3% |
| Interquartile Range (IQR) | 9.7% | 6.7% |
| Standard Deviation (Sample) | 9.2% | 6.9% |
| Standard Deviation (Population) | 9.2% | 6.8% |
Similar Demographics by Poverty
Demographics Similar to Creek by Poverty
In terms of poverty, the demographic groups most similar to Creek are African (15.6%, a difference of 0.070%), Choctaw (15.6%, a difference of 0.18%), Seminole (15.6%, a difference of 0.23%), Dutch West Indian (15.6%, a difference of 0.32%), and Immigrants from Guatemala (15.5%, a difference of 0.44%).
| Demographics | Rating | Rank | Poverty |
| Senegalese | 0.0 /100 | #299 | Tragic 15.3% |
| Immigrants | Central America | 0.0 /100 | #300 | Tragic 15.4% |
| Bahamians | 0.0 /100 | #301 | Tragic 15.4% |
| Somalis | 0.0 /100 | #302 | Tragic 15.4% |
| Immigrants | Caribbean | 0.0 /100 | #303 | Tragic 15.5% |
| Immigrants | Mexico | 0.0 /100 | #304 | Tragic 15.5% |
| Immigrants | Guatemala | 0.0 /100 | #305 | Tragic 15.5% |
| Creek | 0.0 /100 | #306 | Tragic 15.6% |
| Africans | 0.0 /100 | #307 | Tragic 15.6% |
| Choctaw | 0.0 /100 | #308 | Tragic 15.6% |
| Seminole | 0.0 /100 | #309 | Tragic 15.6% |
| Dutch West Indians | 0.0 /100 | #310 | Tragic 15.6% |
| Chippewa | 0.0 /100 | #311 | Tragic 15.7% |
| Cajuns | 0.0 /100 | #312 | Tragic 15.7% |
| Immigrants | Grenada | 0.0 /100 | #313 | Tragic 15.8% |
Demographics Similar to West Indians by Poverty
In terms of poverty, the demographic groups most similar to West Indians are Vietnamese (15.0%, a difference of 0.050%), Immigrants from Haiti (15.0%, a difference of 0.10%), Comanche (15.0%, a difference of 0.23%), Immigrants from Latin America (15.0%, a difference of 0.32%), and Inupiat (15.1%, a difference of 0.53%).
| Demographics | Rating | Rank | Poverty |
| Bangladeshis | 0.0 /100 | #277 | Tragic 14.8% |
| Belizeans | 0.0 /100 | #278 | Tragic 14.8% |
| Immigrants | St. Vincent and the Grenadines | 0.0 /100 | #279 | Tragic 14.9% |
| Haitians | 0.0 /100 | #280 | Tragic 14.9% |
| Immigrants | Barbados | 0.0 /100 | #281 | Tragic 14.9% |
| Comanche | 0.0 /100 | #282 | Tragic 15.0% |
| Immigrants | Haiti | 0.0 /100 | #283 | Tragic 15.0% |
| West Indians | 0.0 /100 | #284 | Tragic 15.0% |
| Vietnamese | 0.0 /100 | #285 | Tragic 15.0% |
| Immigrants | Latin America | 0.0 /100 | #286 | Tragic 15.0% |
| Inupiat | 0.0 /100 | #287 | Tragic 15.1% |
| Yaqui | 0.0 /100 | #288 | Tragic 15.1% |
| Immigrants | Belize | 0.0 /100 | #289 | Tragic 15.1% |
| Mexicans | 0.0 /100 | #290 | Tragic 15.1% |
| Immigrants | Cabo Verde | 0.0 /100 | #291 | Tragic 15.1% |