Iraqi vs Haitian Poverty
COMPARE
Iraqi
Haitian
Poverty
Poverty Comparison
Iraqis
Haitians
12.7%
POVERTY
20.8/ 100
METRIC RATING
196th/ 347
METRIC RANK
14.9%
POVERTY
0.0/ 100
METRIC RATING
280th/ 347
METRIC RANK
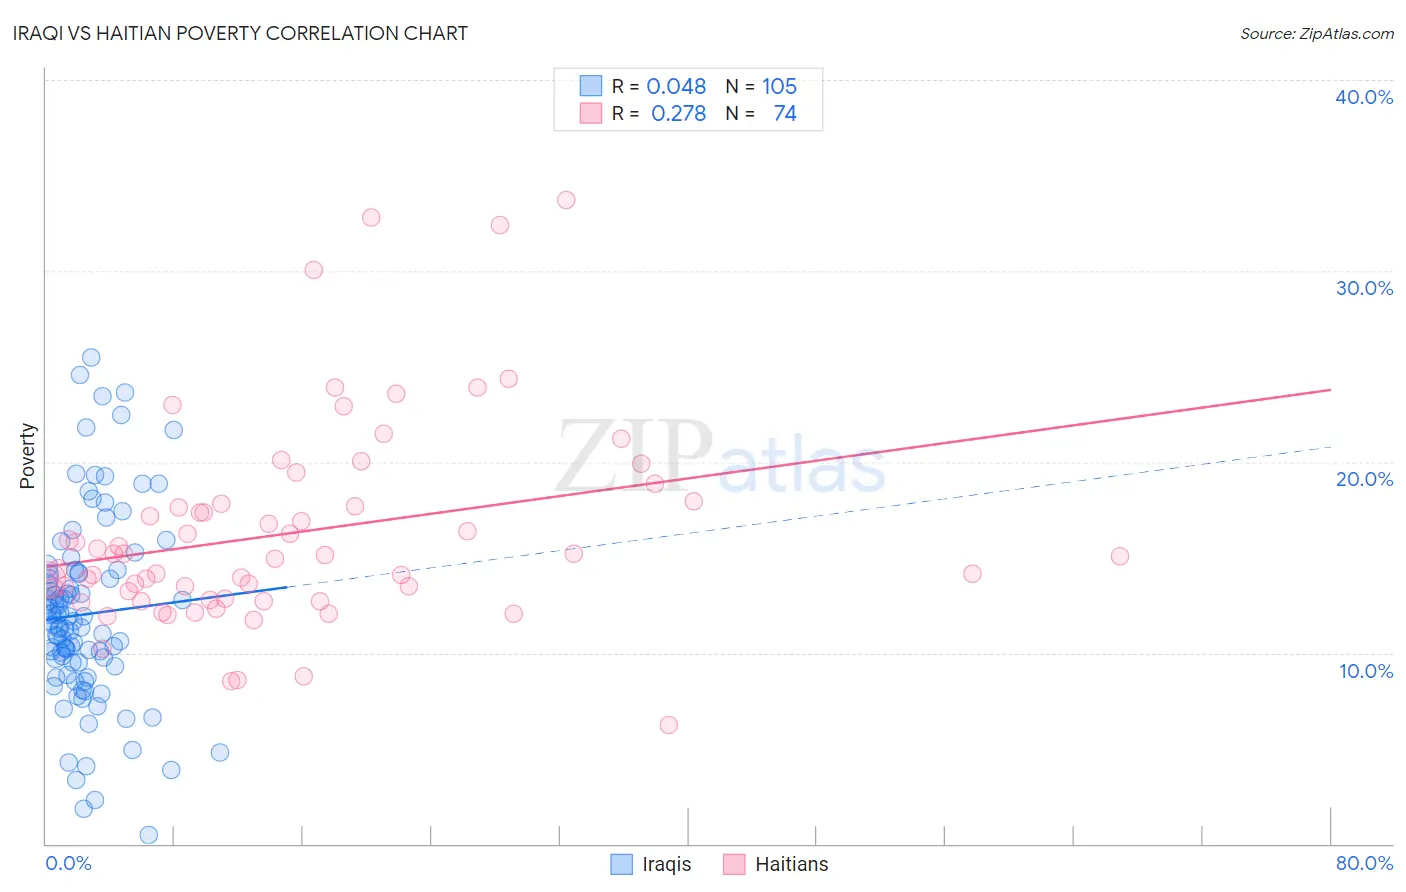
Iraqi vs Haitian Poverty Correlation Chart
The statistical analysis conducted on geographies consisting of 170,596,700 people shows no correlation between the proportion of Iraqis and poverty level in the United States with a correlation coefficient (R) of 0.048 and weighted average of 12.7%. Similarly, the statistical analysis conducted on geographies consisting of 287,739,300 people shows a weak positive correlation between the proportion of Haitians and poverty level in the United States with a correlation coefficient (R) of 0.278 and weighted average of 14.9%, a difference of 17.1%.
Poverty Correlation Summary
| Measurement | Iraqi | Haitian |
| Minimum | 0.47% | 6.2% |
| Maximum | 25.4% | 33.7% |
| Range | 25.0% | 27.5% |
| Mean | 12.0% | 16.3% |
| Median | 11.5% | 15.1% |
| Interquartile 25% (IQ1) | 9.4% | 12.8% |
| Interquartile 75% (IQ3) | 14.2% | 17.8% |
| Interquartile Range (IQR) | 4.8% | 5.0% |
| Standard Deviation (Sample) | 4.9% | 5.4% |
| Standard Deviation (Population) | 4.9% | 5.4% |
Similar Demographics by Poverty
Demographics Similar to Iraqis by Poverty
In terms of poverty, the demographic groups most similar to Iraqis are Immigrants from Kuwait (12.7%, a difference of 0.020%), Arab (12.7%, a difference of 0.050%), Delaware (12.7%, a difference of 0.090%), Immigrants from Lebanon (12.8%, a difference of 0.31%), and Spanish (12.8%, a difference of 0.31%).
| Demographics | Rating | Rank | Poverty |
| Aleuts | 33.2 /100 | #189 | Fair 12.5% |
| Immigrants | South America | 32.3 /100 | #190 | Fair 12.5% |
| Sierra Leoneans | 31.5 /100 | #191 | Fair 12.6% |
| South American Indians | 23.3 /100 | #192 | Fair 12.7% |
| Delaware | 21.4 /100 | #193 | Fair 12.7% |
| Arabs | 21.1 /100 | #194 | Fair 12.7% |
| Immigrants | Kuwait | 20.9 /100 | #195 | Fair 12.7% |
| Iraqis | 20.8 /100 | #196 | Fair 12.7% |
| Immigrants | Lebanon | 18.7 /100 | #197 | Poor 12.8% |
| Spanish | 18.7 /100 | #198 | Poor 12.8% |
| Immigrants | Kenya | 17.5 /100 | #199 | Poor 12.8% |
| Spaniards | 16.5 /100 | #200 | Poor 12.8% |
| Immigrants | Uganda | 16.5 /100 | #201 | Poor 12.8% |
| Immigrants | Uruguay | 15.6 /100 | #202 | Poor 12.8% |
| Hmong | 15.0 /100 | #203 | Poor 12.8% |
Demographics Similar to Haitians by Poverty
In terms of poverty, the demographic groups most similar to Haitians are Immigrants from Barbados (14.9%, a difference of 0.070%), Immigrants from St. Vincent and the Grenadines (14.9%, a difference of 0.20%), Comanche (15.0%, a difference of 0.40%), Belizean (14.8%, a difference of 0.49%), and Bangladeshi (14.8%, a difference of 0.51%).
| Demographics | Rating | Rank | Poverty |
| Spanish Americans | 0.0 /100 | #273 | Tragic 14.7% |
| Barbadians | 0.0 /100 | #274 | Tragic 14.8% |
| Immigrants | West Indies | 0.0 /100 | #275 | Tragic 14.8% |
| Immigrants | Bahamas | 0.0 /100 | #276 | Tragic 14.8% |
| Bangladeshis | 0.0 /100 | #277 | Tragic 14.8% |
| Belizeans | 0.0 /100 | #278 | Tragic 14.8% |
| Immigrants | St. Vincent and the Grenadines | 0.0 /100 | #279 | Tragic 14.9% |
| Haitians | 0.0 /100 | #280 | Tragic 14.9% |
| Immigrants | Barbados | 0.0 /100 | #281 | Tragic 14.9% |
| Comanche | 0.0 /100 | #282 | Tragic 15.0% |
| Immigrants | Haiti | 0.0 /100 | #283 | Tragic 15.0% |
| West Indians | 0.0 /100 | #284 | Tragic 15.0% |
| Vietnamese | 0.0 /100 | #285 | Tragic 15.0% |
| Immigrants | Latin America | 0.0 /100 | #286 | Tragic 15.0% |
| Inupiat | 0.0 /100 | #287 | Tragic 15.1% |