Iraqi vs Immigrants from Africa Poverty
COMPARE
Iraqi
Immigrants from Africa
Poverty
Poverty Comparison
Iraqis
Immigrants from Africa
12.7%
POVERTY
20.8/ 100
METRIC RATING
196th/ 347
METRIC RANK
13.4%
POVERTY
2.5/ 100
METRIC RATING
223rd/ 347
METRIC RANK
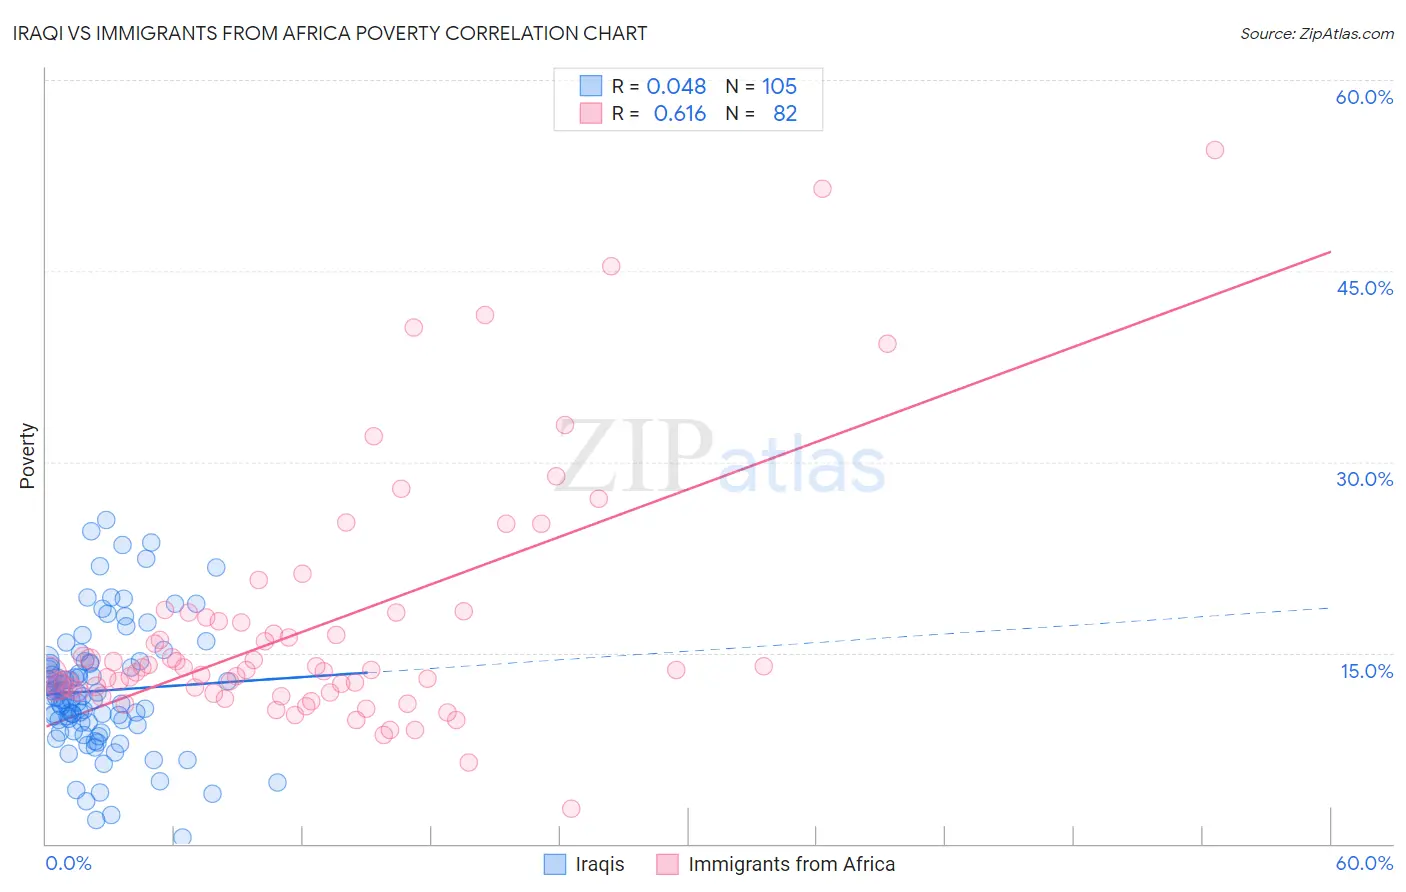
Iraqi vs Immigrants from Africa Poverty Correlation Chart
The statistical analysis conducted on geographies consisting of 170,596,700 people shows no correlation between the proportion of Iraqis and poverty level in the United States with a correlation coefficient (R) of 0.048 and weighted average of 12.7%. Similarly, the statistical analysis conducted on geographies consisting of 468,948,524 people shows a significant positive correlation between the proportion of Immigrants from Africa and poverty level in the United States with a correlation coefficient (R) of 0.616 and weighted average of 13.4%, a difference of 5.4%.
Poverty Correlation Summary
| Measurement | Iraqi | Immigrants from Africa |
| Minimum | 0.47% | 2.7% |
| Maximum | 25.4% | 54.5% |
| Range | 25.0% | 51.8% |
| Mean | 12.0% | 17.1% |
| Median | 11.5% | 13.7% |
| Interquartile 25% (IQ1) | 9.4% | 12.0% |
| Interquartile 75% (IQ3) | 14.2% | 17.8% |
| Interquartile Range (IQR) | 4.8% | 5.8% |
| Standard Deviation (Sample) | 4.9% | 9.7% |
| Standard Deviation (Population) | 4.9% | 9.7% |
Similar Demographics by Poverty
Demographics Similar to Iraqis by Poverty
In terms of poverty, the demographic groups most similar to Iraqis are Immigrants from Kuwait (12.7%, a difference of 0.020%), Arab (12.7%, a difference of 0.050%), Delaware (12.7%, a difference of 0.090%), Immigrants from Lebanon (12.8%, a difference of 0.31%), and Spanish (12.8%, a difference of 0.31%).
| Demographics | Rating | Rank | Poverty |
| Aleuts | 33.2 /100 | #189 | Fair 12.5% |
| Immigrants | South America | 32.3 /100 | #190 | Fair 12.5% |
| Sierra Leoneans | 31.5 /100 | #191 | Fair 12.6% |
| South American Indians | 23.3 /100 | #192 | Fair 12.7% |
| Delaware | 21.4 /100 | #193 | Fair 12.7% |
| Arabs | 21.1 /100 | #194 | Fair 12.7% |
| Immigrants | Kuwait | 20.9 /100 | #195 | Fair 12.7% |
| Iraqis | 20.8 /100 | #196 | Fair 12.7% |
| Immigrants | Lebanon | 18.7 /100 | #197 | Poor 12.8% |
| Spanish | 18.7 /100 | #198 | Poor 12.8% |
| Immigrants | Kenya | 17.5 /100 | #199 | Poor 12.8% |
| Spaniards | 16.5 /100 | #200 | Poor 12.8% |
| Immigrants | Uganda | 16.5 /100 | #201 | Poor 12.8% |
| Immigrants | Uruguay | 15.6 /100 | #202 | Poor 12.8% |
| Hmong | 15.0 /100 | #203 | Poor 12.8% |
Demographics Similar to Immigrants from Africa by Poverty
In terms of poverty, the demographic groups most similar to Immigrants from Africa are Immigrants from Micronesia (13.4%, a difference of 0.040%), Alsatian (13.4%, a difference of 0.080%), Immigrants from Eritrea (13.4%, a difference of 0.10%), American (13.4%, a difference of 0.28%), and German Russian (13.4%, a difference of 0.31%).
| Demographics | Rating | Rank | Poverty |
| Immigrants | Nonimmigrants | 3.3 /100 | #216 | Tragic 13.3% |
| Immigrants | Uzbekistan | 3.2 /100 | #217 | Tragic 13.3% |
| Immigrants | Thailand | 3.1 /100 | #218 | Tragic 13.3% |
| Immigrants | Cambodia | 3.0 /100 | #219 | Tragic 13.4% |
| Americans | 2.9 /100 | #220 | Tragic 13.4% |
| Alsatians | 2.6 /100 | #221 | Tragic 13.4% |
| Immigrants | Micronesia | 2.6 /100 | #222 | Tragic 13.4% |
| Immigrants | Africa | 2.5 /100 | #223 | Tragic 13.4% |
| Immigrants | Eritrea | 2.4 /100 | #224 | Tragic 13.4% |
| German Russians | 2.2 /100 | #225 | Tragic 13.4% |
| Marshallese | 2.2 /100 | #226 | Tragic 13.4% |
| Alaska Natives | 2.1 /100 | #227 | Tragic 13.5% |
| Immigrants | Nigeria | 1.7 /100 | #228 | Tragic 13.5% |
| Osage | 1.5 /100 | #229 | Tragic 13.6% |
| Alaskan Athabascans | 1.5 /100 | #230 | Tragic 13.6% |