Chippewa vs West Indian Poverty
COMPARE
Chippewa
West Indian
Poverty
Poverty Comparison
Chippewa
West Indians
15.7%
POVERTY
0.0/ 100
METRIC RATING
311th/ 347
METRIC RANK
15.0%
POVERTY
0.0/ 100
METRIC RATING
284th/ 347
METRIC RANK
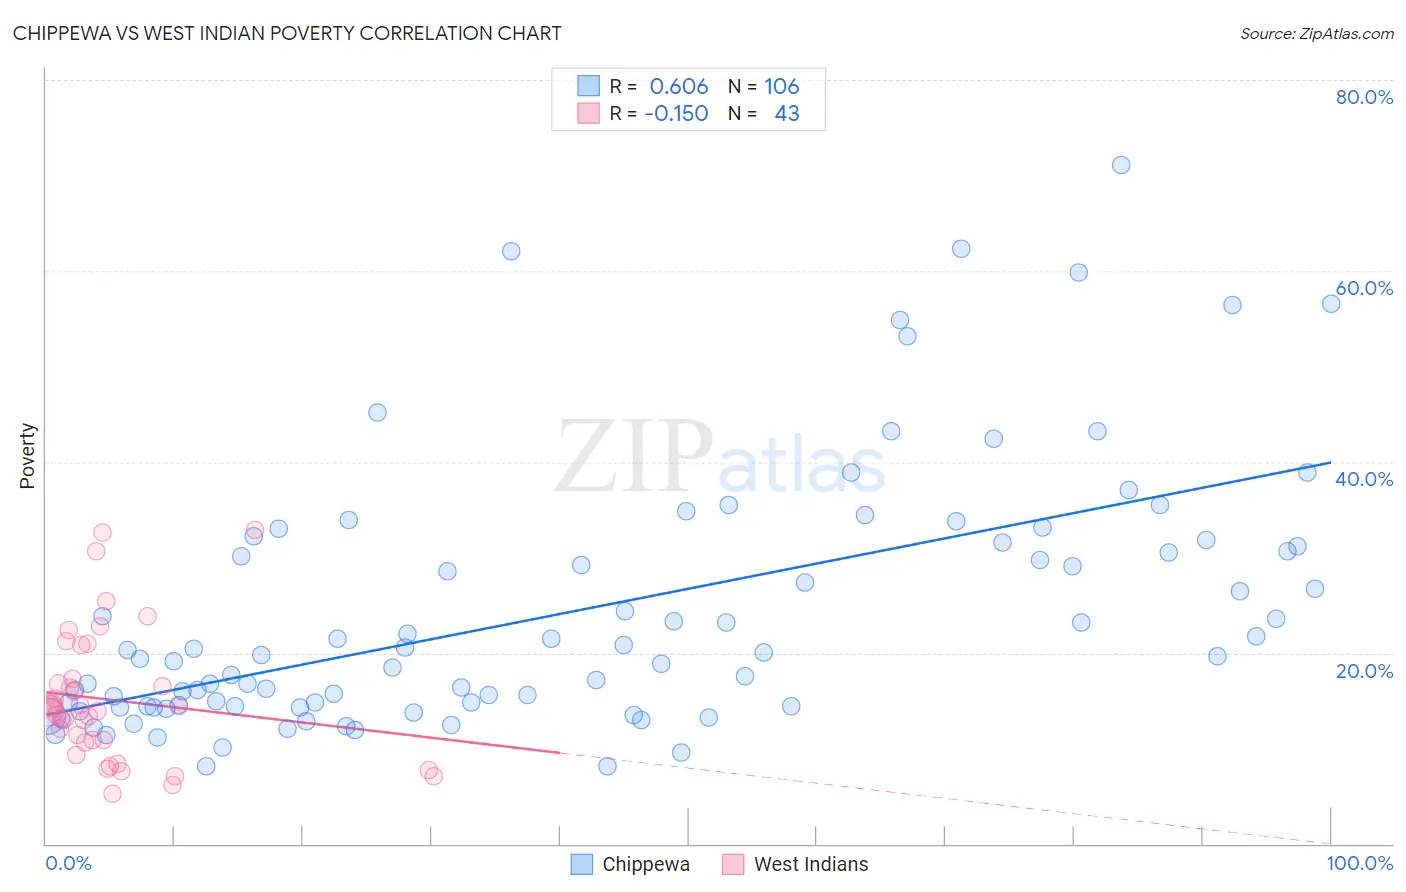
Chippewa vs West Indian Poverty Correlation Chart
The statistical analysis conducted on geographies consisting of 215,014,776 people shows a significant positive correlation between the proportion of Chippewa and poverty level in the United States with a correlation coefficient (R) of 0.606 and weighted average of 15.7%. Similarly, the statistical analysis conducted on geographies consisting of 253,897,912 people shows a poor negative correlation between the proportion of West Indians and poverty level in the United States with a correlation coefficient (R) of -0.150 and weighted average of 15.0%, a difference of 4.6%.
Poverty Correlation Summary
| Measurement | Chippewa | West Indian |
| Minimum | 8.1% | 5.3% |
| Maximum | 71.1% | 32.8% |
| Range | 63.0% | 27.5% |
| Mean | 24.2% | 15.1% |
| Median | 19.7% | 14.1% |
| Interquartile 25% (IQ1) | 14.4% | 10.6% |
| Interquartile 75% (IQ3) | 31.1% | 17.3% |
| Interquartile Range (IQR) | 16.7% | 6.7% |
| Standard Deviation (Sample) | 13.5% | 6.9% |
| Standard Deviation (Population) | 13.4% | 6.8% |
Similar Demographics by Poverty
Demographics Similar to Chippewa by Poverty
In terms of poverty, the demographic groups most similar to Chippewa are Cajun (15.7%, a difference of 0.16%), Dutch West Indian (15.6%, a difference of 0.39%), Seminole (15.6%, a difference of 0.48%), Choctaw (15.6%, a difference of 0.52%), and Immigrants from Grenada (15.8%, a difference of 0.60%).
| Demographics | Rating | Rank | Poverty |
| Immigrants | Mexico | 0.0 /100 | #304 | Tragic 15.5% |
| Immigrants | Guatemala | 0.0 /100 | #305 | Tragic 15.5% |
| Creek | 0.0 /100 | #306 | Tragic 15.6% |
| Africans | 0.0 /100 | #307 | Tragic 15.6% |
| Choctaw | 0.0 /100 | #308 | Tragic 15.6% |
| Seminole | 0.0 /100 | #309 | Tragic 15.6% |
| Dutch West Indians | 0.0 /100 | #310 | Tragic 15.6% |
| Chippewa | 0.0 /100 | #311 | Tragic 15.7% |
| Cajuns | 0.0 /100 | #312 | Tragic 15.7% |
| Immigrants | Grenada | 0.0 /100 | #313 | Tragic 15.8% |
| Immigrants | Somalia | 0.0 /100 | #314 | Tragic 15.8% |
| British West Indians | 0.0 /100 | #315 | Tragic 15.9% |
| Hondurans | 0.0 /100 | #316 | Tragic 15.9% |
| U.S. Virgin Islanders | 0.0 /100 | #317 | Tragic 16.1% |
| Immigrants | Dominica | 0.0 /100 | #318 | Tragic 16.1% |
Demographics Similar to West Indians by Poverty
In terms of poverty, the demographic groups most similar to West Indians are Vietnamese (15.0%, a difference of 0.050%), Immigrants from Haiti (15.0%, a difference of 0.10%), Comanche (15.0%, a difference of 0.23%), Immigrants from Latin America (15.0%, a difference of 0.32%), and Inupiat (15.1%, a difference of 0.53%).
| Demographics | Rating | Rank | Poverty |
| Bangladeshis | 0.0 /100 | #277 | Tragic 14.8% |
| Belizeans | 0.0 /100 | #278 | Tragic 14.8% |
| Immigrants | St. Vincent and the Grenadines | 0.0 /100 | #279 | Tragic 14.9% |
| Haitians | 0.0 /100 | #280 | Tragic 14.9% |
| Immigrants | Barbados | 0.0 /100 | #281 | Tragic 14.9% |
| Comanche | 0.0 /100 | #282 | Tragic 15.0% |
| Immigrants | Haiti | 0.0 /100 | #283 | Tragic 15.0% |
| West Indians | 0.0 /100 | #284 | Tragic 15.0% |
| Vietnamese | 0.0 /100 | #285 | Tragic 15.0% |
| Immigrants | Latin America | 0.0 /100 | #286 | Tragic 15.0% |
| Inupiat | 0.0 /100 | #287 | Tragic 15.1% |
| Yaqui | 0.0 /100 | #288 | Tragic 15.1% |
| Immigrants | Belize | 0.0 /100 | #289 | Tragic 15.1% |
| Mexicans | 0.0 /100 | #290 | Tragic 15.1% |
| Immigrants | Cabo Verde | 0.0 /100 | #291 | Tragic 15.1% |