Native Hawaiian vs West Indian Poverty
COMPARE
Native Hawaiian
West Indian
Poverty
Poverty Comparison
Native Hawaiians
West Indians
11.6%
POVERTY
92.1/ 100
METRIC RATING
104th/ 347
METRIC RANK
15.0%
POVERTY
0.0/ 100
METRIC RATING
284th/ 347
METRIC RANK
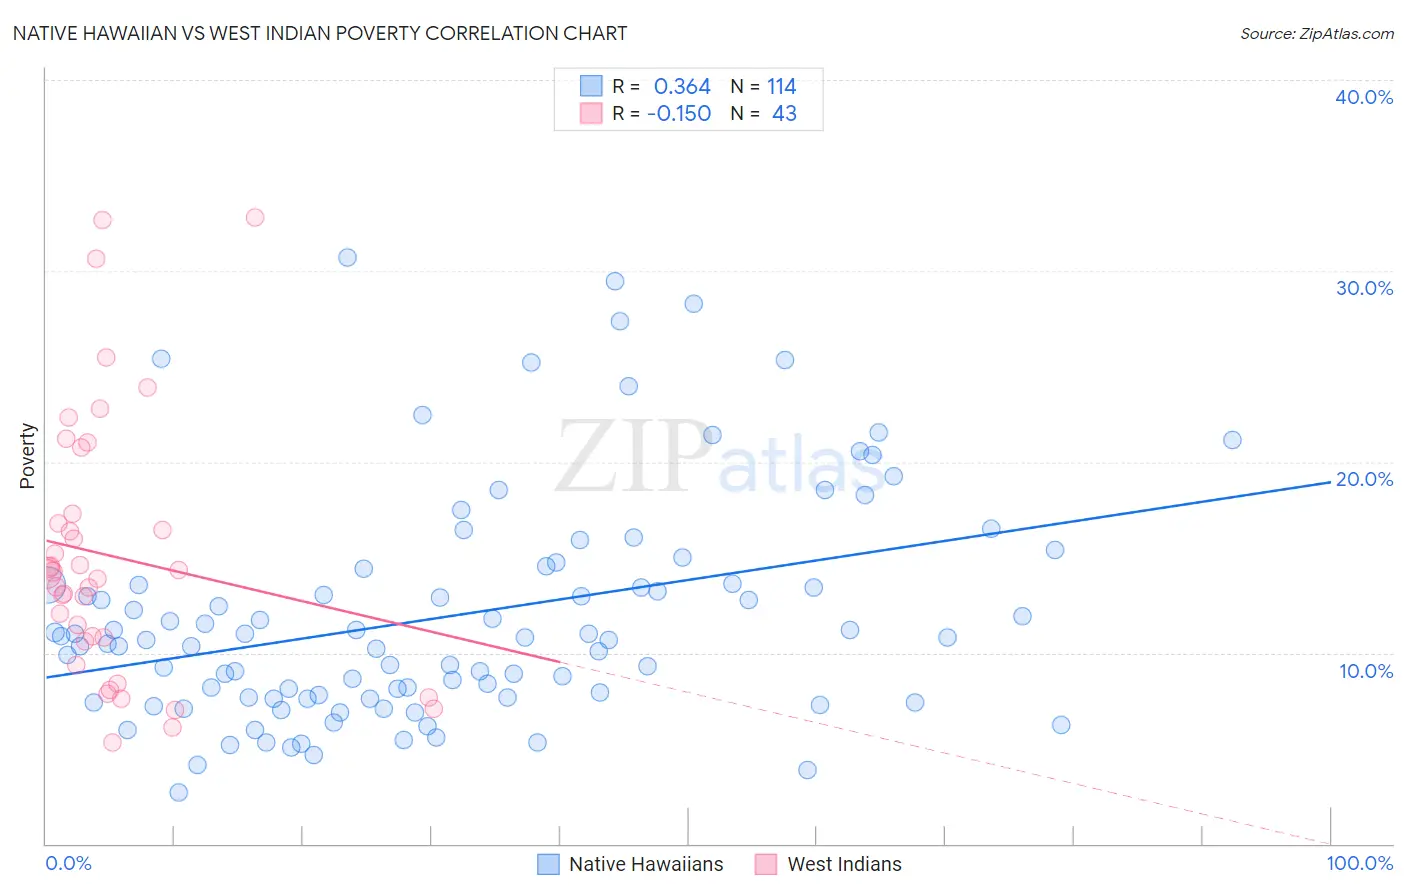
Native Hawaiian vs West Indian Poverty Correlation Chart
The statistical analysis conducted on geographies consisting of 331,880,799 people shows a mild positive correlation between the proportion of Native Hawaiians and poverty level in the United States with a correlation coefficient (R) of 0.364 and weighted average of 11.6%. Similarly, the statistical analysis conducted on geographies consisting of 253,897,912 people shows a poor negative correlation between the proportion of West Indians and poverty level in the United States with a correlation coefficient (R) of -0.150 and weighted average of 15.0%, a difference of 29.4%.
Poverty Correlation Summary
| Measurement | Native Hawaiian | West Indian |
| Minimum | 2.7% | 5.3% |
| Maximum | 30.7% | 32.8% |
| Range | 28.0% | 27.5% |
| Mean | 11.9% | 15.1% |
| Median | 10.7% | 14.1% |
| Interquartile 25% (IQ1) | 7.6% | 10.6% |
| Interquartile 75% (IQ3) | 13.6% | 17.3% |
| Interquartile Range (IQR) | 6.0% | 6.7% |
| Standard Deviation (Sample) | 5.9% | 6.9% |
| Standard Deviation (Population) | 5.9% | 6.8% |
Similar Demographics by Poverty
Demographics Similar to Native Hawaiians by Poverty
In terms of poverty, the demographic groups most similar to Native Hawaiians are Portuguese (11.6%, a difference of 0.020%), Immigrants from Zimbabwe (11.6%, a difference of 0.020%), Laotian (11.6%, a difference of 0.11%), Okinawan (11.6%, a difference of 0.11%), and Palestinian (11.6%, a difference of 0.11%).
| Demographics | Rating | Rank | Poverty |
| Immigrants | Egypt | 94.6 /100 | #97 | Exceptional 11.5% |
| Immigrants | Latvia | 94.5 /100 | #98 | Exceptional 11.5% |
| Immigrants | Indonesia | 94.2 /100 | #99 | Exceptional 11.5% |
| Scottish | 94.0 /100 | #100 | Exceptional 11.5% |
| Slavs | 93.3 /100 | #101 | Exceptional 11.5% |
| Laotians | 92.4 /100 | #102 | Exceptional 11.6% |
| Okinawans | 92.4 /100 | #103 | Exceptional 11.6% |
| Native Hawaiians | 92.1 /100 | #104 | Exceptional 11.6% |
| Portuguese | 92.1 /100 | #105 | Exceptional 11.6% |
| Immigrants | Zimbabwe | 92.1 /100 | #106 | Exceptional 11.6% |
| Palestinians | 91.8 /100 | #107 | Exceptional 11.6% |
| Canadians | 91.7 /100 | #108 | Exceptional 11.6% |
| Immigrants | Turkey | 91.7 /100 | #109 | Exceptional 11.6% |
| Welsh | 91.6 /100 | #110 | Exceptional 11.6% |
| French Canadians | 91.0 /100 | #111 | Exceptional 11.6% |
Demographics Similar to West Indians by Poverty
In terms of poverty, the demographic groups most similar to West Indians are Vietnamese (15.0%, a difference of 0.050%), Immigrants from Haiti (15.0%, a difference of 0.10%), Comanche (15.0%, a difference of 0.23%), Immigrants from Latin America (15.0%, a difference of 0.32%), and Inupiat (15.1%, a difference of 0.53%).
| Demographics | Rating | Rank | Poverty |
| Bangladeshis | 0.0 /100 | #277 | Tragic 14.8% |
| Belizeans | 0.0 /100 | #278 | Tragic 14.8% |
| Immigrants | St. Vincent and the Grenadines | 0.0 /100 | #279 | Tragic 14.9% |
| Haitians | 0.0 /100 | #280 | Tragic 14.9% |
| Immigrants | Barbados | 0.0 /100 | #281 | Tragic 14.9% |
| Comanche | 0.0 /100 | #282 | Tragic 15.0% |
| Immigrants | Haiti | 0.0 /100 | #283 | Tragic 15.0% |
| West Indians | 0.0 /100 | #284 | Tragic 15.0% |
| Vietnamese | 0.0 /100 | #285 | Tragic 15.0% |
| Immigrants | Latin America | 0.0 /100 | #286 | Tragic 15.0% |
| Inupiat | 0.0 /100 | #287 | Tragic 15.1% |
| Yaqui | 0.0 /100 | #288 | Tragic 15.1% |
| Immigrants | Belize | 0.0 /100 | #289 | Tragic 15.1% |
| Mexicans | 0.0 /100 | #290 | Tragic 15.1% |
| Immigrants | Cabo Verde | 0.0 /100 | #291 | Tragic 15.1% |