Iraqi vs West Indian Hearing Disability
COMPARE
Iraqi
West Indian
Hearing Disability
Hearing Disability Comparison
Iraqis
West Indians
3.1%
HEARING DISABILITY
19.0/ 100
METRIC RATING
201st/ 347
METRIC RANK
2.6%
HEARING DISABILITY
99.4/ 100
METRIC RATING
42nd/ 347
METRIC RANK
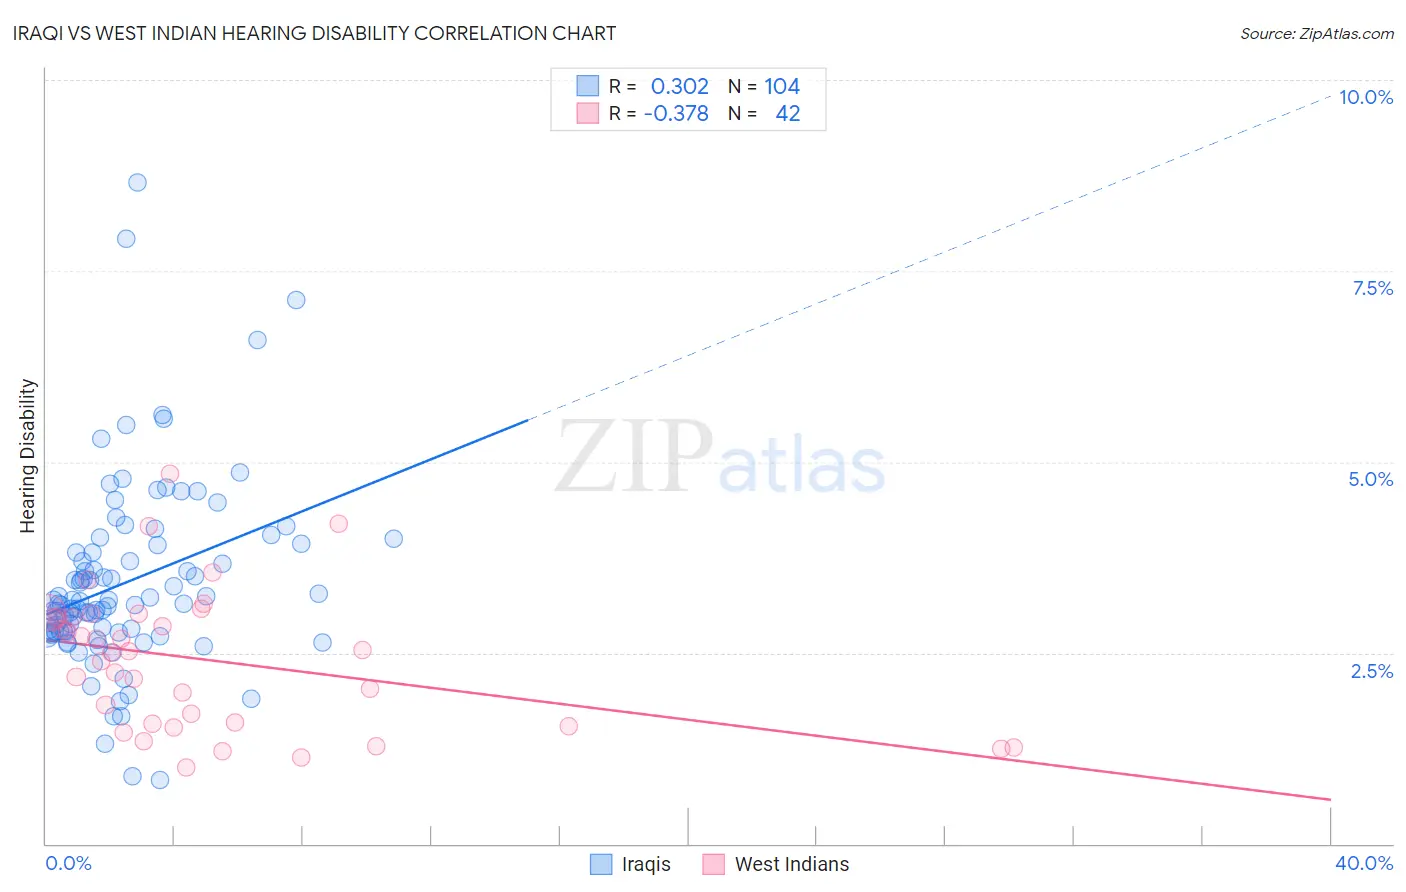
Iraqi vs West Indian Hearing Disability Correlation Chart
The statistical analysis conducted on geographies consisting of 170,639,688 people shows a mild positive correlation between the proportion of Iraqis and percentage of population with hearing disability in the United States with a correlation coefficient (R) of 0.302 and weighted average of 3.1%. Similarly, the statistical analysis conducted on geographies consisting of 253,938,353 people shows a mild negative correlation between the proportion of West Indians and percentage of population with hearing disability in the United States with a correlation coefficient (R) of -0.378 and weighted average of 2.6%, a difference of 17.5%.
Hearing Disability Correlation Summary
| Measurement | Iraqi | West Indian |
| Minimum | 0.83% | 1.0% |
| Maximum | 8.7% | 4.8% |
| Range | 7.8% | 3.8% |
| Mean | 3.4% | 2.4% |
| Median | 3.1% | 2.5% |
| Interquartile 25% (IQ1) | 2.8% | 1.6% |
| Interquartile 75% (IQ3) | 3.9% | 3.0% |
| Interquartile Range (IQR) | 1.1% | 1.4% |
| Standard Deviation (Sample) | 1.2% | 0.91% |
| Standard Deviation (Population) | 1.2% | 0.90% |
Similar Demographics by Hearing Disability
Demographics Similar to Iraqis by Hearing Disability
In terms of hearing disability, the demographic groups most similar to Iraqis are Immigrants from North Macedonia (3.1%, a difference of 0.020%), Syrian (3.1%, a difference of 0.030%), Immigrants from Croatia (3.1%, a difference of 0.22%), Immigrants from Bosnia and Herzegovina (3.1%, a difference of 0.24%), and Immigrants from Thailand (3.1%, a difference of 0.40%).
| Demographics | Rating | Rank | Hearing Disability |
| South Africans | 24.5 /100 | #194 | Fair 3.1% |
| Spanish American Indians | 24.1 /100 | #195 | Fair 3.1% |
| Immigrants | Europe | 22.9 /100 | #196 | Fair 3.1% |
| Immigrants | Bosnia and Herzegovina | 20.6 /100 | #197 | Fair 3.1% |
| Immigrants | Croatia | 20.5 /100 | #198 | Fair 3.1% |
| Syrians | 19.2 /100 | #199 | Poor 3.1% |
| Immigrants | North Macedonia | 19.1 /100 | #200 | Poor 3.1% |
| Iraqis | 19.0 /100 | #201 | Poor 3.1% |
| Immigrants | Thailand | 16.4 /100 | #202 | Poor 3.1% |
| Immigrants | Denmark | 16.2 /100 | #203 | Poor 3.1% |
| Immigrants | Czechoslovakia | 15.9 /100 | #204 | Poor 3.1% |
| Alsatians | 15.9 /100 | #205 | Poor 3.1% |
| Eastern Europeans | 15.5 /100 | #206 | Poor 3.1% |
| Hispanics or Latinos | 15.1 /100 | #207 | Poor 3.1% |
| Immigrants | Latvia | 12.7 /100 | #208 | Poor 3.1% |
Demographics Similar to West Indians by Hearing Disability
In terms of hearing disability, the demographic groups most similar to West Indians are Immigrants from Taiwan (2.6%, a difference of 0.010%), Senegalese (2.6%, a difference of 0.010%), Nigerian (2.6%, a difference of 0.23%), Venezuelan (2.6%, a difference of 0.25%), and Haitian (2.6%, a difference of 0.34%).
| Demographics | Rating | Rank | Hearing Disability |
| Salvadorans | 99.6 /100 | #35 | Exceptional 2.6% |
| Okinawans | 99.6 /100 | #36 | Exceptional 2.6% |
| Immigrants | Western Africa | 99.6 /100 | #37 | Exceptional 2.6% |
| Immigrants | Jamaica | 99.5 /100 | #38 | Exceptional 2.6% |
| Immigrants | China | 99.5 /100 | #39 | Exceptional 2.6% |
| Haitians | 99.5 /100 | #40 | Exceptional 2.6% |
| Immigrants | Taiwan | 99.4 /100 | #41 | Exceptional 2.6% |
| West Indians | 99.4 /100 | #42 | Exceptional 2.6% |
| Senegalese | 99.4 /100 | #43 | Exceptional 2.6% |
| Nigerians | 99.4 /100 | #44 | Exceptional 2.6% |
| Venezuelans | 99.4 /100 | #45 | Exceptional 2.6% |
| Immigrants | Dominica | 99.3 /100 | #46 | Exceptional 2.6% |
| Immigrants | Israel | 99.3 /100 | #47 | Exceptional 2.6% |
| Immigrants | Singapore | 99.3 /100 | #48 | Exceptional 2.6% |
| Immigrants | South America | 99.2 /100 | #49 | Exceptional 2.7% |