Iranian vs Immigrants from Jamaica Male Poverty
COMPARE
Iranian
Immigrants from Jamaica
Male Poverty
Male Poverty Comparison
Iranians
Immigrants from Jamaica
9.8%
MALE POVERTY
99.4/ 100
METRIC RATING
35th/ 347
METRIC RANK
13.3%
MALE POVERTY
0.1/ 100
METRIC RATING
267th/ 347
METRIC RANK
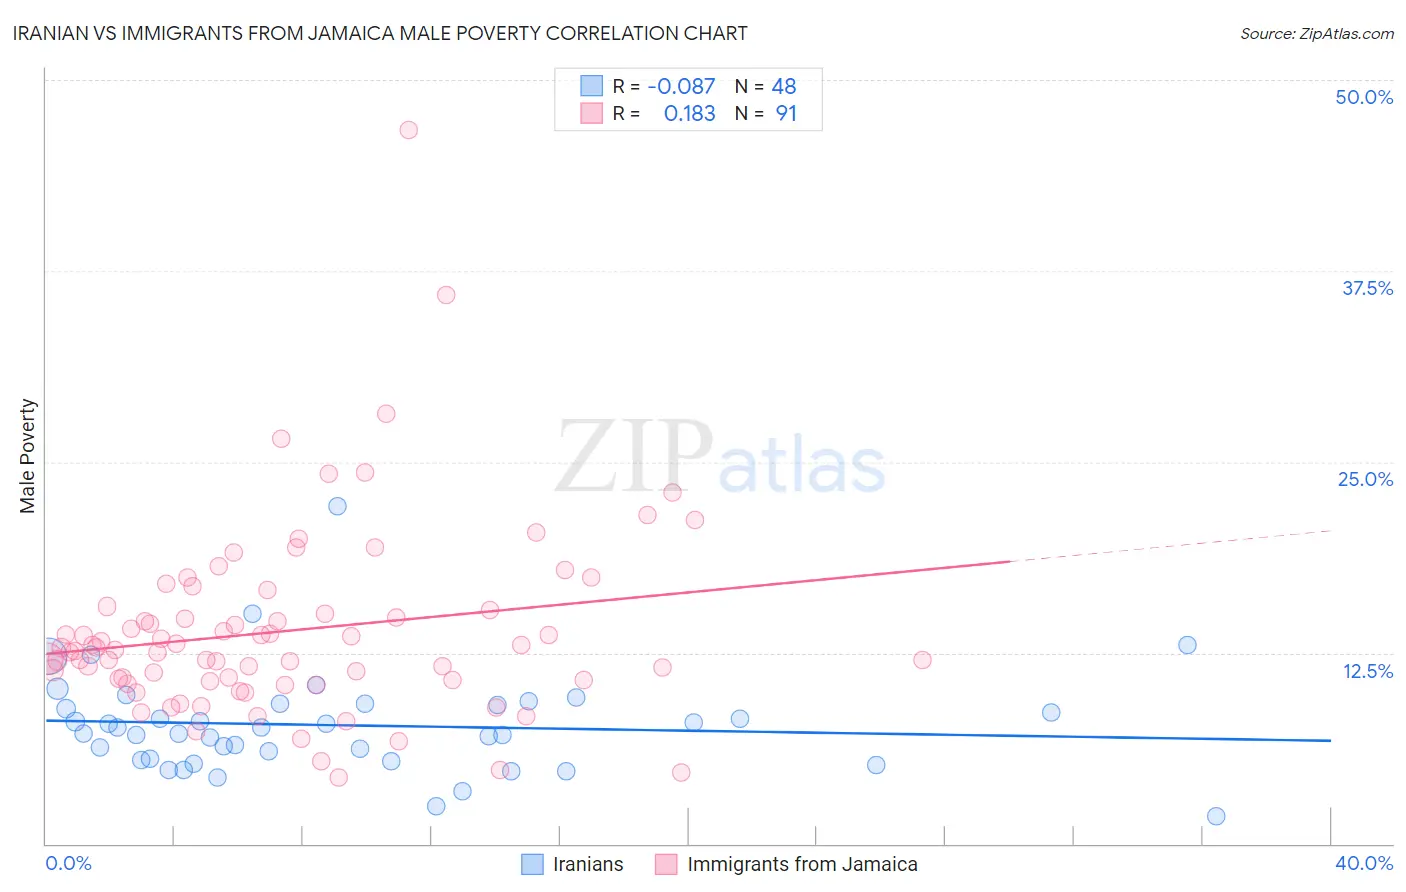
Iranian vs Immigrants from Jamaica Male Poverty Correlation Chart
The statistical analysis conducted on geographies consisting of 316,583,039 people shows a slight negative correlation between the proportion of Iranians and poverty level among males in the United States with a correlation coefficient (R) of -0.087 and weighted average of 9.8%. Similarly, the statistical analysis conducted on geographies consisting of 301,555,462 people shows a poor positive correlation between the proportion of Immigrants from Jamaica and poverty level among males in the United States with a correlation coefficient (R) of 0.183 and weighted average of 13.3%, a difference of 35.4%.
Male Poverty Correlation Summary
| Measurement | Iranian | Immigrants from Jamaica |
| Minimum | 1.8% | 4.3% |
| Maximum | 22.1% | 46.7% |
| Range | 20.3% | 42.4% |
| Mean | 7.8% | 13.9% |
| Median | 7.4% | 12.7% |
| Interquartile 25% (IQ1) | 5.5% | 10.7% |
| Interquartile 75% (IQ3) | 9.1% | 15.3% |
| Interquartile Range (IQR) | 3.6% | 4.6% |
| Standard Deviation (Sample) | 3.4% | 6.2% |
| Standard Deviation (Population) | 3.3% | 6.2% |
Similar Demographics by Male Poverty
Demographics Similar to Iranians by Male Poverty
In terms of male poverty, the demographic groups most similar to Iranians are Czech (9.8%, a difference of 0.090%), Immigrants from Poland (9.8%, a difference of 0.30%), Immigrants from Greece (9.8%, a difference of 0.31%), Immigrants from Northern Europe (9.7%, a difference of 0.45%), and Macedonian (9.7%, a difference of 0.54%).
| Demographics | Rating | Rank | Male Poverty |
| Immigrants | Korea | 99.6 /100 | #28 | Exceptional 9.7% |
| Greeks | 99.6 /100 | #29 | Exceptional 9.7% |
| Poles | 99.5 /100 | #30 | Exceptional 9.7% |
| Tongans | 99.5 /100 | #31 | Exceptional 9.7% |
| Macedonians | 99.5 /100 | #32 | Exceptional 9.7% |
| Immigrants | Northern Europe | 99.5 /100 | #33 | Exceptional 9.7% |
| Immigrants | Poland | 99.5 /100 | #34 | Exceptional 9.8% |
| Iranians | 99.4 /100 | #35 | Exceptional 9.8% |
| Czechs | 99.4 /100 | #36 | Exceptional 9.8% |
| Immigrants | Greece | 99.3 /100 | #37 | Exceptional 9.8% |
| Immigrants | Pakistan | 99.2 /100 | #38 | Exceptional 9.9% |
| Russians | 99.2 /100 | #39 | Exceptional 9.9% |
| Cypriots | 99.2 /100 | #40 | Exceptional 9.9% |
| Koreans | 99.2 /100 | #41 | Exceptional 9.9% |
| Immigrants | Iran | 99.1 /100 | #42 | Exceptional 9.9% |
Demographics Similar to Immigrants from Jamaica by Male Poverty
In terms of male poverty, the demographic groups most similar to Immigrants from Jamaica are Subsaharan African (13.3%, a difference of 0.030%), Immigrants from Guyana (13.2%, a difference of 0.11%), Guyanese (13.3%, a difference of 0.25%), Jamaican (13.2%, a difference of 0.26%), and Iroquois (13.2%, a difference of 0.28%).
| Demographics | Rating | Rank | Male Poverty |
| Ottawa | 0.1 /100 | #260 | Tragic 13.1% |
| Trinidadians and Tobagonians | 0.1 /100 | #261 | Tragic 13.1% |
| Spanish American Indians | 0.1 /100 | #262 | Tragic 13.1% |
| Central Americans | 0.1 /100 | #263 | Tragic 13.2% |
| Iroquois | 0.1 /100 | #264 | Tragic 13.2% |
| Jamaicans | 0.1 /100 | #265 | Tragic 13.2% |
| Immigrants | Guyana | 0.1 /100 | #266 | Tragic 13.2% |
| Immigrants | Jamaica | 0.1 /100 | #267 | Tragic 13.3% |
| Sub-Saharan Africans | 0.1 /100 | #268 | Tragic 13.3% |
| Guyanese | 0.0 /100 | #269 | Tragic 13.3% |
| Cree | 0.0 /100 | #270 | Tragic 13.3% |
| Spanish Americans | 0.0 /100 | #271 | Tragic 13.4% |
| Immigrants | Bahamas | 0.0 /100 | #272 | Tragic 13.5% |
| Chickasaw | 0.0 /100 | #273 | Tragic 13.5% |
| Immigrants | West Indies | 0.0 /100 | #274 | Tragic 13.5% |