Iranian vs Syrian Family Households with Children
COMPARE
Iranian
Syrian
Family Households with Children
Family Households with Children Comparison
Iranians
Syrians
27.7%
FAMILY HOUSEHOLDS WITH CHILDREN
85.2/ 100
METRIC RATING
133rd/ 347
METRIC RANK
27.8%
FAMILY HOUSEHOLDS WITH CHILDREN
89.7/ 100
METRIC RATING
128th/ 347
METRIC RANK
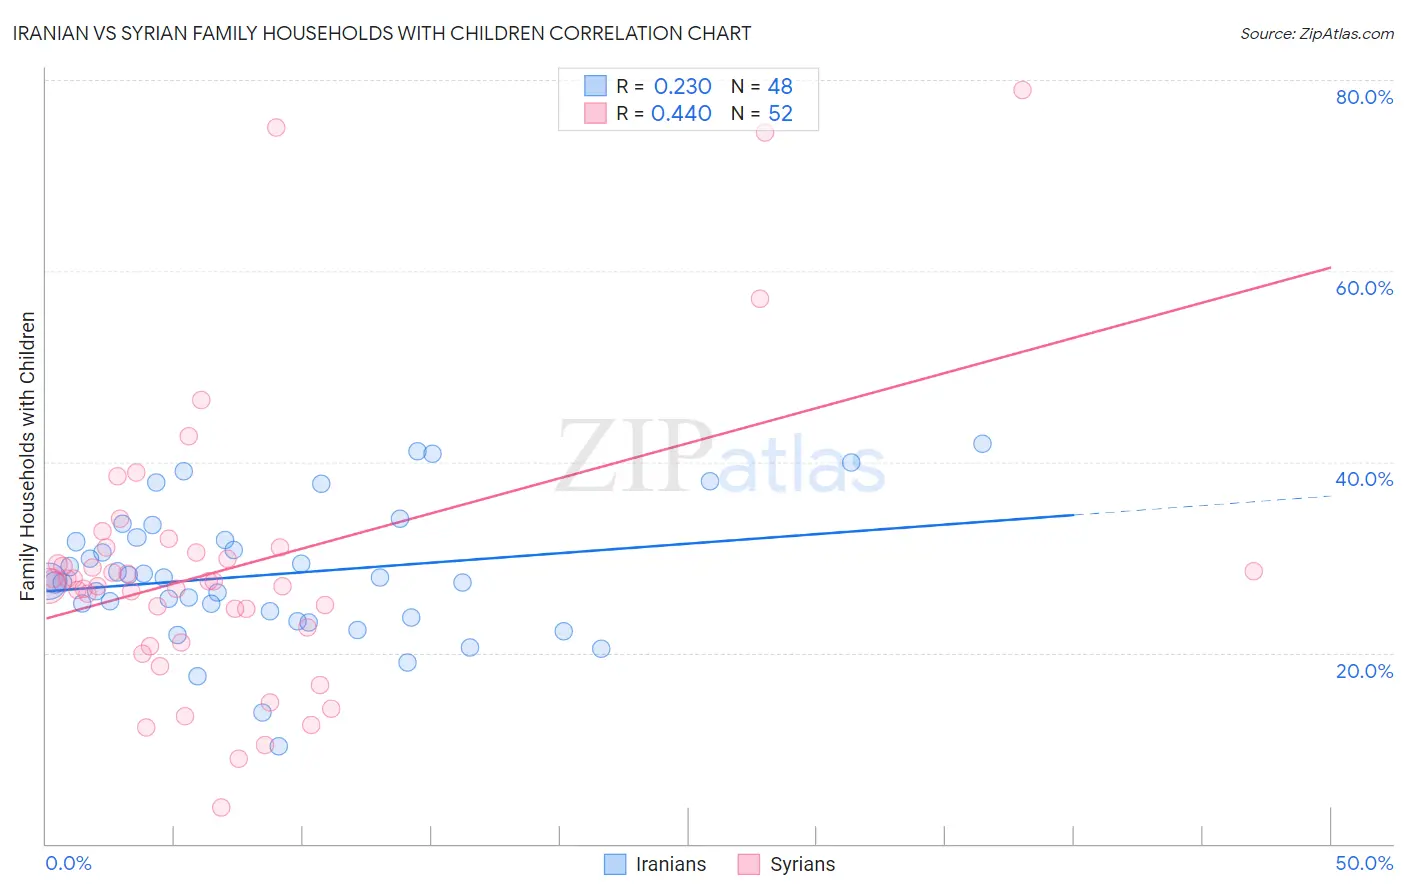
Iranian vs Syrian Family Households with Children Correlation Chart
The statistical analysis conducted on geographies consisting of 316,530,986 people shows a weak positive correlation between the proportion of Iranians and percentage of family households with children in the United States with a correlation coefficient (R) of 0.230 and weighted average of 27.7%. Similarly, the statistical analysis conducted on geographies consisting of 266,095,178 people shows a moderate positive correlation between the proportion of Syrians and percentage of family households with children in the United States with a correlation coefficient (R) of 0.440 and weighted average of 27.8%, a difference of 0.22%.
Family Households with Children Correlation Summary
| Measurement | Iranian | Syrian |
| Minimum | 10.2% | 3.8% |
| Maximum | 41.9% | 78.9% |
| Range | 31.7% | 75.1% |
| Mean | 28.2% | 29.0% |
| Median | 27.7% | 27.2% |
| Interquartile 25% (IQ1) | 24.0% | 21.8% |
| Interquartile 75% (IQ3) | 31.9% | 30.8% |
| Interquartile Range (IQR) | 7.9% | 8.9% |
| Standard Deviation (Sample) | 7.0% | 15.0% |
| Standard Deviation (Population) | 6.9% | 14.8% |
Demographics Similar to Iranians and Syrians by Family Households with Children
In terms of family households with children, the demographic groups most similar to Iranians are Immigrants from Panama (27.7%, a difference of 0.010%), Immigrants from Belize (27.7%, a difference of 0.020%), Immigrants from Ecuador (27.7%, a difference of 0.030%), Immigrants from Portugal (27.7%, a difference of 0.040%), and Immigrants from Dominican Republic (27.7%, a difference of 0.060%). Similarly, the demographic groups most similar to Syrians are Belizean (27.8%, a difference of 0.020%), Immigrants from Eritrea (27.8%, a difference of 0.020%), Immigrants from Ethiopia (27.8%, a difference of 0.050%), Immigrants from Singapore (27.8%, a difference of 0.070%), and Ecuadorian (27.8%, a difference of 0.070%).
| Demographics | Rating | Rank | Family Households with Children |
| Europeans | 95.4 /100 | #120 | Exceptional 27.9% |
| Immigrants | Western Asia | 93.6 /100 | #121 | Exceptional 27.9% |
| Immigrants | Zimbabwe | 92.8 /100 | #122 | Exceptional 27.8% |
| Immigrants | Northern Africa | 91.8 /100 | #123 | Exceptional 27.8% |
| Immigrants | Singapore | 90.8 /100 | #124 | Exceptional 27.8% |
| Ecuadorians | 90.8 /100 | #125 | Exceptional 27.8% |
| Immigrants | Ethiopia | 90.5 /100 | #126 | Exceptional 27.8% |
| Belizeans | 90.0 /100 | #127 | Exceptional 27.8% |
| Syrians | 89.7 /100 | #128 | Excellent 27.8% |
| Immigrants | Eritrea | 89.4 /100 | #129 | Excellent 27.8% |
| Cajuns | 87.6 /100 | #130 | Excellent 27.7% |
| Lebanese | 87.4 /100 | #131 | Excellent 27.7% |
| Immigrants | Belize | 85.7 /100 | #132 | Excellent 27.7% |
| Iranians | 85.2 /100 | #133 | Excellent 27.7% |
| Immigrants | Panama | 84.9 /100 | #134 | Excellent 27.7% |
| Immigrants | Ecuador | 84.6 /100 | #135 | Excellent 27.7% |
| Immigrants | Portugal | 84.1 /100 | #136 | Excellent 27.7% |
| Immigrants | Dominican Republic | 83.9 /100 | #137 | Excellent 27.7% |
| Uruguayans | 83.2 /100 | #138 | Excellent 27.7% |
| Vietnamese | 82.6 /100 | #139 | Excellent 27.7% |
| Spanish | 81.8 /100 | #140 | Excellent 27.7% |