Iranian vs Immigrants from Somalia Male Poverty
COMPARE
Iranian
Immigrants from Somalia
Male Poverty
Male Poverty Comparison
Iranians
Immigrants from Somalia
9.8%
MALE POVERTY
99.4/ 100
METRIC RATING
35th/ 347
METRIC RANK
14.6%
MALE POVERTY
0.0/ 100
METRIC RATING
313th/ 347
METRIC RANK
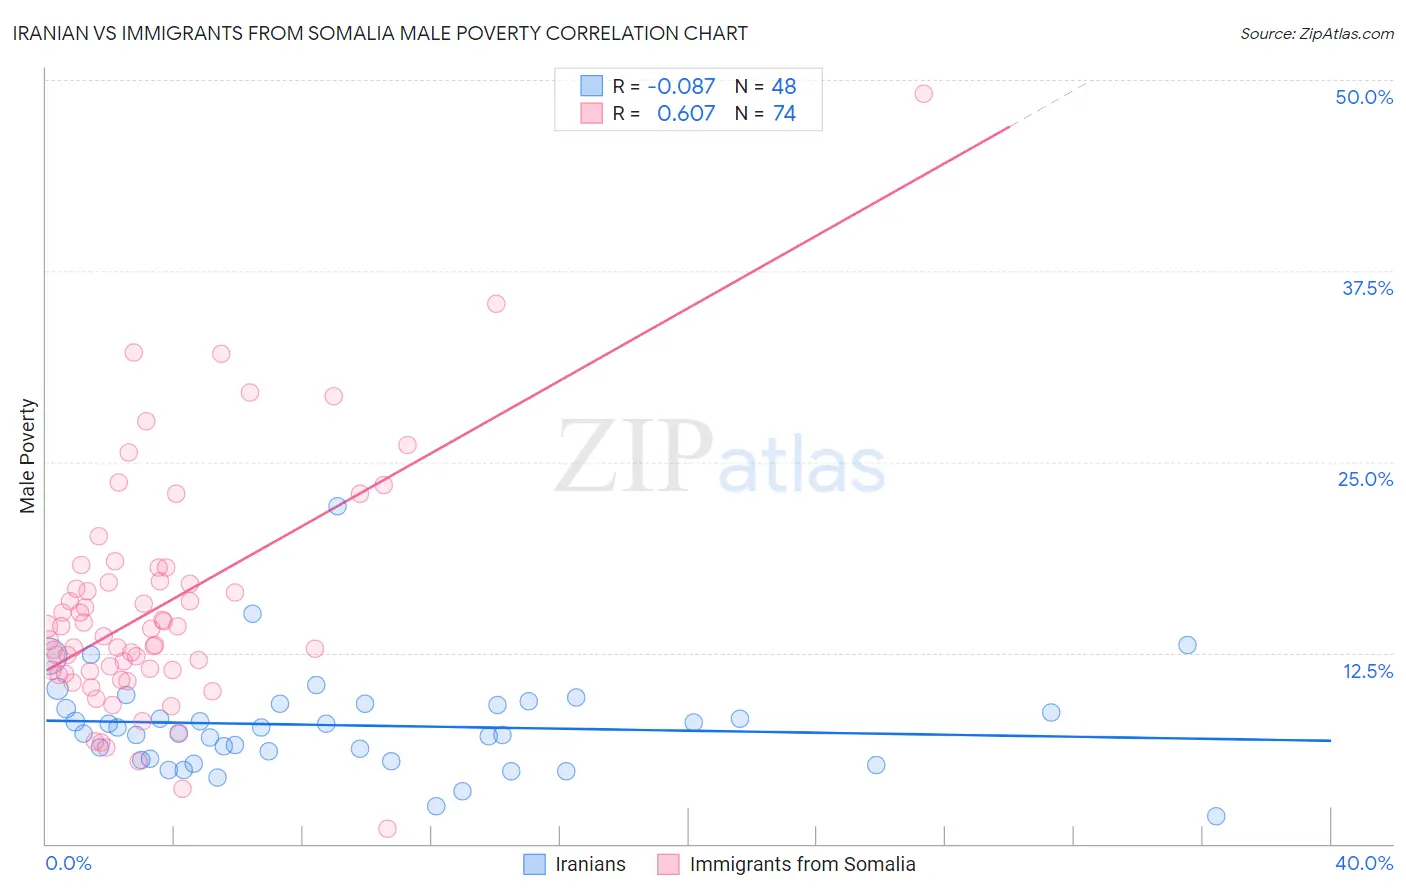
Iranian vs Immigrants from Somalia Male Poverty Correlation Chart
The statistical analysis conducted on geographies consisting of 316,583,039 people shows a slight negative correlation between the proportion of Iranians and poverty level among males in the United States with a correlation coefficient (R) of -0.087 and weighted average of 9.8%. Similarly, the statistical analysis conducted on geographies consisting of 92,092,836 people shows a significant positive correlation between the proportion of Immigrants from Somalia and poverty level among males in the United States with a correlation coefficient (R) of 0.607 and weighted average of 14.6%, a difference of 48.9%.
Male Poverty Correlation Summary
| Measurement | Iranian | Immigrants from Somalia |
| Minimum | 1.8% | 1.0% |
| Maximum | 22.1% | 49.1% |
| Range | 20.3% | 48.1% |
| Mean | 7.8% | 15.5% |
| Median | 7.4% | 13.8% |
| Interquartile 25% (IQ1) | 5.5% | 11.3% |
| Interquartile 75% (IQ3) | 9.1% | 17.2% |
| Interquartile Range (IQR) | 3.6% | 5.9% |
| Standard Deviation (Sample) | 3.4% | 7.8% |
| Standard Deviation (Population) | 3.3% | 7.7% |
Similar Demographics by Male Poverty
Demographics Similar to Iranians by Male Poverty
In terms of male poverty, the demographic groups most similar to Iranians are Czech (9.8%, a difference of 0.090%), Immigrants from Poland (9.8%, a difference of 0.30%), Immigrants from Greece (9.8%, a difference of 0.31%), Immigrants from Northern Europe (9.7%, a difference of 0.45%), and Macedonian (9.7%, a difference of 0.54%).
| Demographics | Rating | Rank | Male Poverty |
| Immigrants | Korea | 99.6 /100 | #28 | Exceptional 9.7% |
| Greeks | 99.6 /100 | #29 | Exceptional 9.7% |
| Poles | 99.5 /100 | #30 | Exceptional 9.7% |
| Tongans | 99.5 /100 | #31 | Exceptional 9.7% |
| Macedonians | 99.5 /100 | #32 | Exceptional 9.7% |
| Immigrants | Northern Europe | 99.5 /100 | #33 | Exceptional 9.7% |
| Immigrants | Poland | 99.5 /100 | #34 | Exceptional 9.8% |
| Iranians | 99.4 /100 | #35 | Exceptional 9.8% |
| Czechs | 99.4 /100 | #36 | Exceptional 9.8% |
| Immigrants | Greece | 99.3 /100 | #37 | Exceptional 9.8% |
| Immigrants | Pakistan | 99.2 /100 | #38 | Exceptional 9.9% |
| Russians | 99.2 /100 | #39 | Exceptional 9.9% |
| Cypriots | 99.2 /100 | #40 | Exceptional 9.9% |
| Koreans | 99.2 /100 | #41 | Exceptional 9.9% |
| Immigrants | Iran | 99.1 /100 | #42 | Exceptional 9.9% |
Demographics Similar to Immigrants from Somalia by Male Poverty
In terms of male poverty, the demographic groups most similar to Immigrants from Somalia are Immigrants from Honduras (14.6%, a difference of 0.040%), Chippewa (14.6%, a difference of 0.11%), British West Indian (14.6%, a difference of 0.14%), Immigrants from Dominica (14.7%, a difference of 0.82%), and Immigrants from Grenada (14.7%, a difference of 0.87%).
| Demographics | Rating | Rank | Male Poverty |
| Creek | 0.0 /100 | #306 | Tragic 14.1% |
| Dutch West Indians | 0.0 /100 | #307 | Tragic 14.2% |
| Africans | 0.0 /100 | #308 | Tragic 14.2% |
| Somalis | 0.0 /100 | #309 | Tragic 14.3% |
| Seminole | 0.0 /100 | #310 | Tragic 14.3% |
| Hondurans | 0.0 /100 | #311 | Tragic 14.3% |
| Choctaw | 0.0 /100 | #312 | Tragic 14.4% |
| Immigrants | Somalia | 0.0 /100 | #313 | Tragic 14.6% |
| Immigrants | Honduras | 0.0 /100 | #314 | Tragic 14.6% |
| Chippewa | 0.0 /100 | #315 | Tragic 14.6% |
| British West Indians | 0.0 /100 | #316 | Tragic 14.6% |
| Immigrants | Dominica | 0.0 /100 | #317 | Tragic 14.7% |
| Immigrants | Grenada | 0.0 /100 | #318 | Tragic 14.7% |
| U.S. Virgin Islanders | 0.0 /100 | #319 | Tragic 14.7% |
| Immigrants | Congo | 0.0 /100 | #320 | Tragic 14.7% |