Iranian vs Korean Family Households
COMPARE
Iranian
Korean
Family Households
Family Households Comparison
Iranians
Koreans
63.9%
FAMILY HOUSEHOLDS
13.5/ 100
METRIC RATING
202nd/ 347
METRIC RANK
68.3%
FAMILY HOUSEHOLDS
100.0/ 100
METRIC RATING
12th/ 347
METRIC RANK
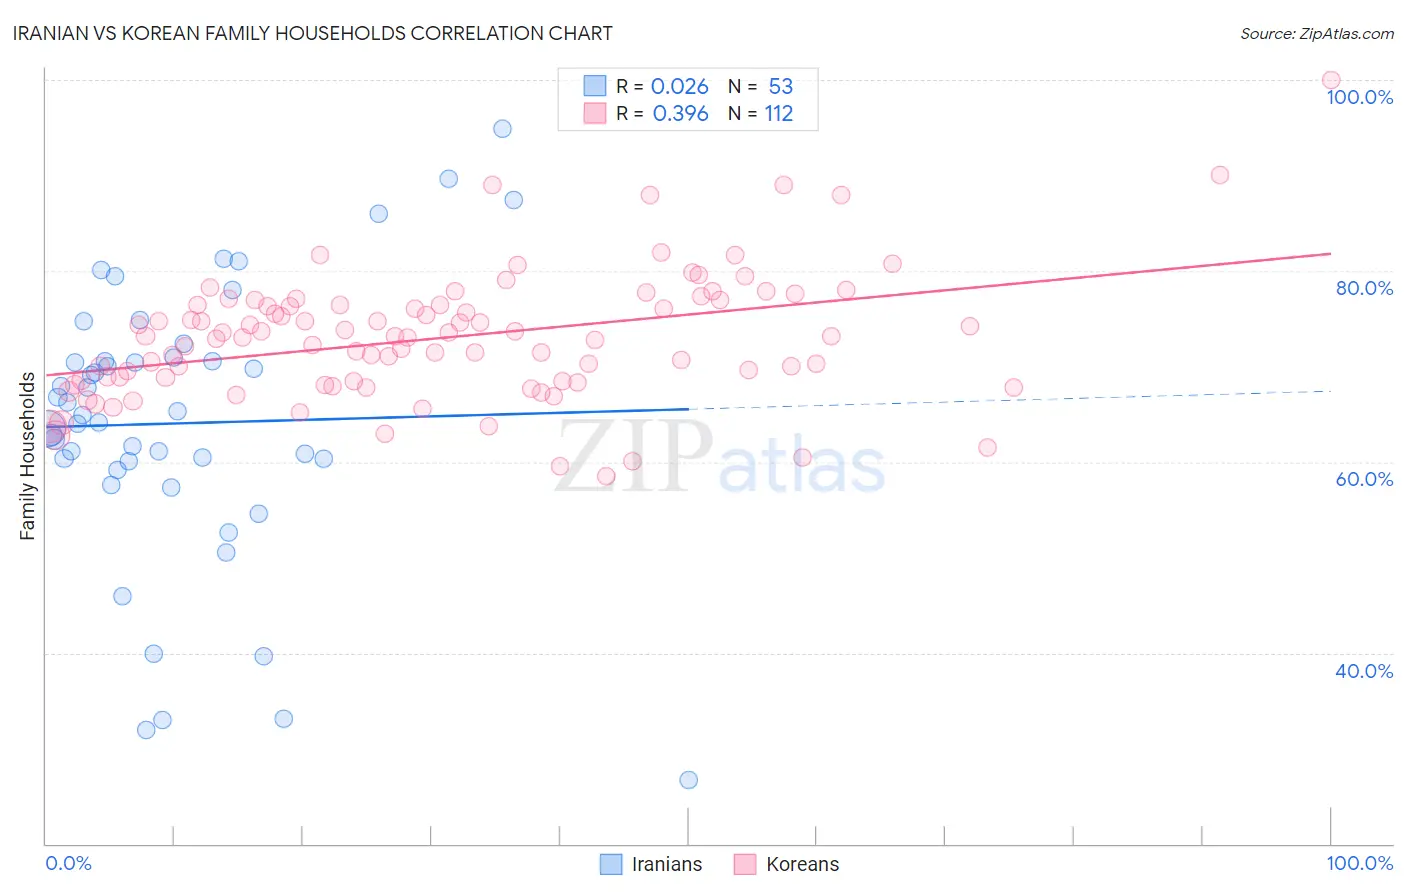
Iranian vs Korean Family Households Correlation Chart
The statistical analysis conducted on geographies consisting of 316,654,989 people shows no correlation between the proportion of Iranians and percentage of family households in the United States with a correlation coefficient (R) of 0.026 and weighted average of 63.9%. Similarly, the statistical analysis conducted on geographies consisting of 510,403,530 people shows a mild positive correlation between the proportion of Koreans and percentage of family households in the United States with a correlation coefficient (R) of 0.396 and weighted average of 68.3%, a difference of 6.8%.
Family Households Correlation Summary
| Measurement | Iranian | Korean |
| Minimum | 26.7% | 58.5% |
| Maximum | 94.9% | 100.0% |
| Range | 68.2% | 41.5% |
| Mean | 64.0% | 73.0% |
| Median | 64.9% | 73.1% |
| Interquartile 25% (IQ1) | 59.6% | 68.4% |
| Interquartile 75% (IQ3) | 70.7% | 76.5% |
| Interquartile Range (IQR) | 11.2% | 8.1% |
| Standard Deviation (Sample) | 14.6% | 6.7% |
| Standard Deviation (Population) | 14.4% | 6.7% |
Similar Demographics by Family Households
Demographics Similar to Iranians by Family Households
In terms of family households, the demographic groups most similar to Iranians are Norwegian (63.9%, a difference of 0.010%), Immigrants from Uruguay (63.9%, a difference of 0.020%), Brazilian (63.9%, a difference of 0.030%), Immigrants from Lithuania (63.9%, a difference of 0.040%), and Nigerian (63.9%, a difference of 0.060%).
| Demographics | Rating | Rank | Family Households |
| Immigrants | North America | 20.0 /100 | #195 | Poor 64.0% |
| Immigrants | Canada | 19.2 /100 | #196 | Poor 64.0% |
| Seminole | 18.9 /100 | #197 | Poor 64.0% |
| Poles | 18.9 /100 | #198 | Poor 64.0% |
| Slavs | 18.6 /100 | #199 | Poor 64.0% |
| Immigrants | Malaysia | 17.9 /100 | #200 | Poor 64.0% |
| Immigrants | Eastern Europe | 17.2 /100 | #201 | Poor 64.0% |
| Iranians | 13.5 /100 | #202 | Poor 63.9% |
| Norwegians | 13.2 /100 | #203 | Poor 63.9% |
| Immigrants | Uruguay | 12.8 /100 | #204 | Poor 63.9% |
| Brazilians | 12.4 /100 | #205 | Poor 63.9% |
| Immigrants | Lithuania | 12.1 /100 | #206 | Poor 63.9% |
| Nigerians | 11.5 /100 | #207 | Poor 63.9% |
| Immigrants | Bangladesh | 11.4 /100 | #208 | Poor 63.9% |
| Sierra Leoneans | 11.2 /100 | #209 | Poor 63.9% |
Demographics Similar to Koreans by Family Households
In terms of family households, the demographic groups most similar to Koreans are Immigrants from Central America (68.3%, a difference of 0.030%), Pueblo (68.2%, a difference of 0.080%), Immigrants from Cuba (68.2%, a difference of 0.090%), Immigrants from Philippines (68.3%, a difference of 0.10%), and Assyrian/Chaldean/Syriac (68.2%, a difference of 0.15%).
| Demographics | Rating | Rank | Family Households |
| Yuman | 100.0 /100 | #5 | Exceptional 69.3% |
| Immigrants | Mexico | 100.0 /100 | #6 | Exceptional 69.1% |
| Mexicans | 100.0 /100 | #7 | Exceptional 69.0% |
| Immigrants | Fiji | 100.0 /100 | #8 | Exceptional 68.8% |
| Native Hawaiians | 100.0 /100 | #9 | Exceptional 68.4% |
| Immigrants | Philippines | 100.0 /100 | #10 | Exceptional 68.3% |
| Immigrants | Central America | 100.0 /100 | #11 | Exceptional 68.3% |
| Koreans | 100.0 /100 | #12 | Exceptional 68.3% |
| Pueblo | 100.0 /100 | #13 | Exceptional 68.2% |
| Immigrants | Cuba | 100.0 /100 | #14 | Exceptional 68.2% |
| Assyrians/Chaldeans/Syriacs | 100.0 /100 | #15 | Exceptional 68.2% |
| Immigrants | Vietnam | 100.0 /100 | #16 | Exceptional 68.2% |
| Chinese | 100.0 /100 | #17 | Exceptional 68.1% |
| Immigrants | Taiwan | 100.0 /100 | #18 | Exceptional 68.0% |
| Samoans | 100.0 /100 | #19 | Exceptional 67.9% |