Immigrants from Afghanistan vs Korean Female Poverty
COMPARE
Immigrants from Afghanistan
Korean
Female Poverty
Female Poverty Comparison
Immigrants from Afghanistan
Koreans
13.4%
FEMALE POVERTY
50.8/ 100
METRIC RATING
173rd/ 347
METRIC RANK
11.9%
FEMALE POVERTY
99.2/ 100
METRIC RATING
43rd/ 347
METRIC RANK
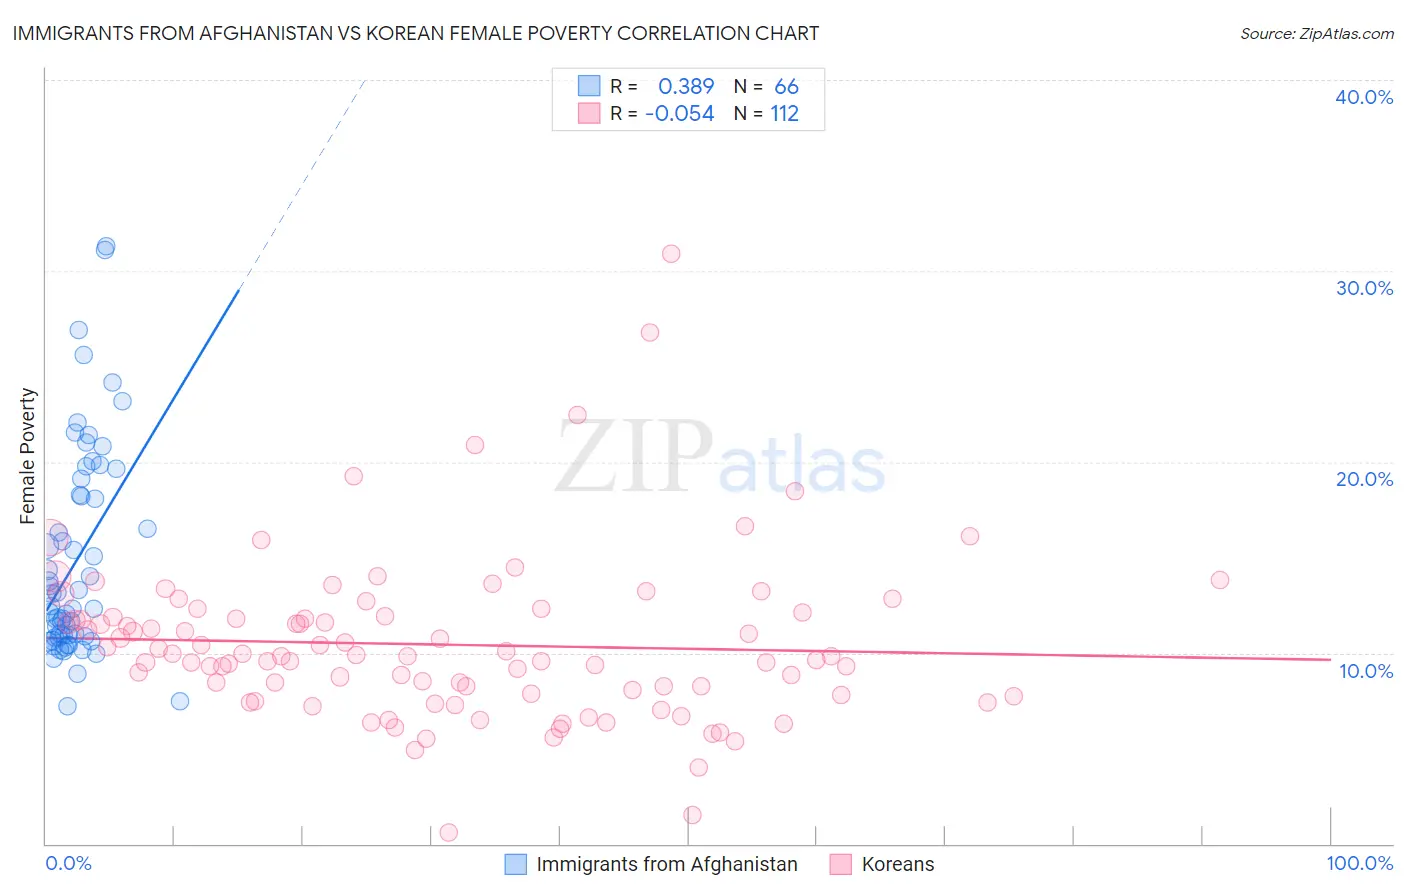
Immigrants from Afghanistan vs Korean Female Poverty Correlation Chart
The statistical analysis conducted on geographies consisting of 147,630,543 people shows a mild positive correlation between the proportion of Immigrants from Afghanistan and poverty level among females in the United States with a correlation coefficient (R) of 0.389 and weighted average of 13.4%. Similarly, the statistical analysis conducted on geographies consisting of 510,221,953 people shows a slight negative correlation between the proportion of Koreans and poverty level among females in the United States with a correlation coefficient (R) of -0.054 and weighted average of 11.9%, a difference of 13.1%.
Female Poverty Correlation Summary
| Measurement | Immigrants from Afghanistan | Korean |
| Minimum | 7.2% | 0.57% |
| Maximum | 31.3% | 30.9% |
| Range | 24.1% | 30.3% |
| Mean | 14.8% | 10.4% |
| Median | 12.4% | 9.8% |
| Interquartile 25% (IQ1) | 10.8% | 7.9% |
| Interquartile 75% (IQ3) | 18.2% | 11.9% |
| Interquartile Range (IQR) | 7.4% | 4.0% |
| Standard Deviation (Sample) | 5.5% | 4.3% |
| Standard Deviation (Population) | 5.4% | 4.3% |
Similar Demographics by Female Poverty
Demographics Similar to Immigrants from Afghanistan by Female Poverty
In terms of female poverty, the demographic groups most similar to Immigrants from Afghanistan are Immigrants from Iraq (13.4%, a difference of 0.070%), Celtic (13.4%, a difference of 0.080%), Immigrants from Spain (13.4%, a difference of 0.090%), Immigrants from Morocco (13.4%, a difference of 0.13%), and Israeli (13.5%, a difference of 0.16%).
| Demographics | Rating | Rank | Female Poverty |
| Immigrants | Oceania | 59.7 /100 | #166 | Average 13.3% |
| Immigrants | Chile | 57.4 /100 | #167 | Average 13.3% |
| Aleuts | 56.7 /100 | #168 | Average 13.4% |
| Lebanese | 55.9 /100 | #169 | Average 13.4% |
| Colombians | 55.7 /100 | #170 | Average 13.4% |
| Whites/Caucasians | 54.6 /100 | #171 | Average 13.4% |
| Mongolians | 53.6 /100 | #172 | Average 13.4% |
| Immigrants | Afghanistan | 50.8 /100 | #173 | Average 13.4% |
| Immigrants | Iraq | 50.0 /100 | #174 | Average 13.4% |
| Celtics | 49.9 /100 | #175 | Average 13.4% |
| Immigrants | Spain | 49.9 /100 | #176 | Average 13.4% |
| Immigrants | Morocco | 49.4 /100 | #177 | Average 13.4% |
| Israelis | 49.1 /100 | #178 | Average 13.5% |
| Immigrants | Syria | 48.8 /100 | #179 | Average 13.5% |
| South Americans | 44.8 /100 | #180 | Average 13.5% |
Demographics Similar to Koreans by Female Poverty
In terms of female poverty, the demographic groups most similar to Koreans are Czech (11.9%, a difference of 0.040%), Immigrants from Moldova (11.9%, a difference of 0.040%), Tongan (11.9%, a difference of 0.070%), Immigrants from Czechoslovakia (11.9%, a difference of 0.16%), and Turkish (11.9%, a difference of 0.16%).
| Demographics | Rating | Rank | Female Poverty |
| Immigrants | Pakistan | 99.4 /100 | #36 | Exceptional 11.8% |
| Immigrants | Greece | 99.3 /100 | #37 | Exceptional 11.8% |
| Russians | 99.3 /100 | #38 | Exceptional 11.8% |
| Immigrants | Poland | 99.3 /100 | #39 | Exceptional 11.8% |
| Macedonians | 99.3 /100 | #40 | Exceptional 11.8% |
| Czechs | 99.2 /100 | #41 | Exceptional 11.9% |
| Immigrants | Moldova | 99.2 /100 | #42 | Exceptional 11.9% |
| Koreans | 99.2 /100 | #43 | Exceptional 11.9% |
| Tongans | 99.2 /100 | #44 | Exceptional 11.9% |
| Immigrants | Czechoslovakia | 99.2 /100 | #45 | Exceptional 11.9% |
| Turks | 99.2 /100 | #46 | Exceptional 11.9% |
| Asians | 99.1 /100 | #47 | Exceptional 11.9% |
| Immigrants | Japan | 99.0 /100 | #48 | Exceptional 11.9% |
| Immigrants | Romania | 99.0 /100 | #49 | Exceptional 12.0% |
| Slovenes | 98.9 /100 | #50 | Exceptional 12.0% |