Iranian vs Mexican Poverty
COMPARE
Iranian
Mexican
Poverty
Poverty Comparison
Iranians
Mexicans
10.7%
POVERTY
99.5/ 100
METRIC RATING
32nd/ 347
METRIC RANK
15.1%
POVERTY
0.0/ 100
METRIC RATING
290th/ 347
METRIC RANK
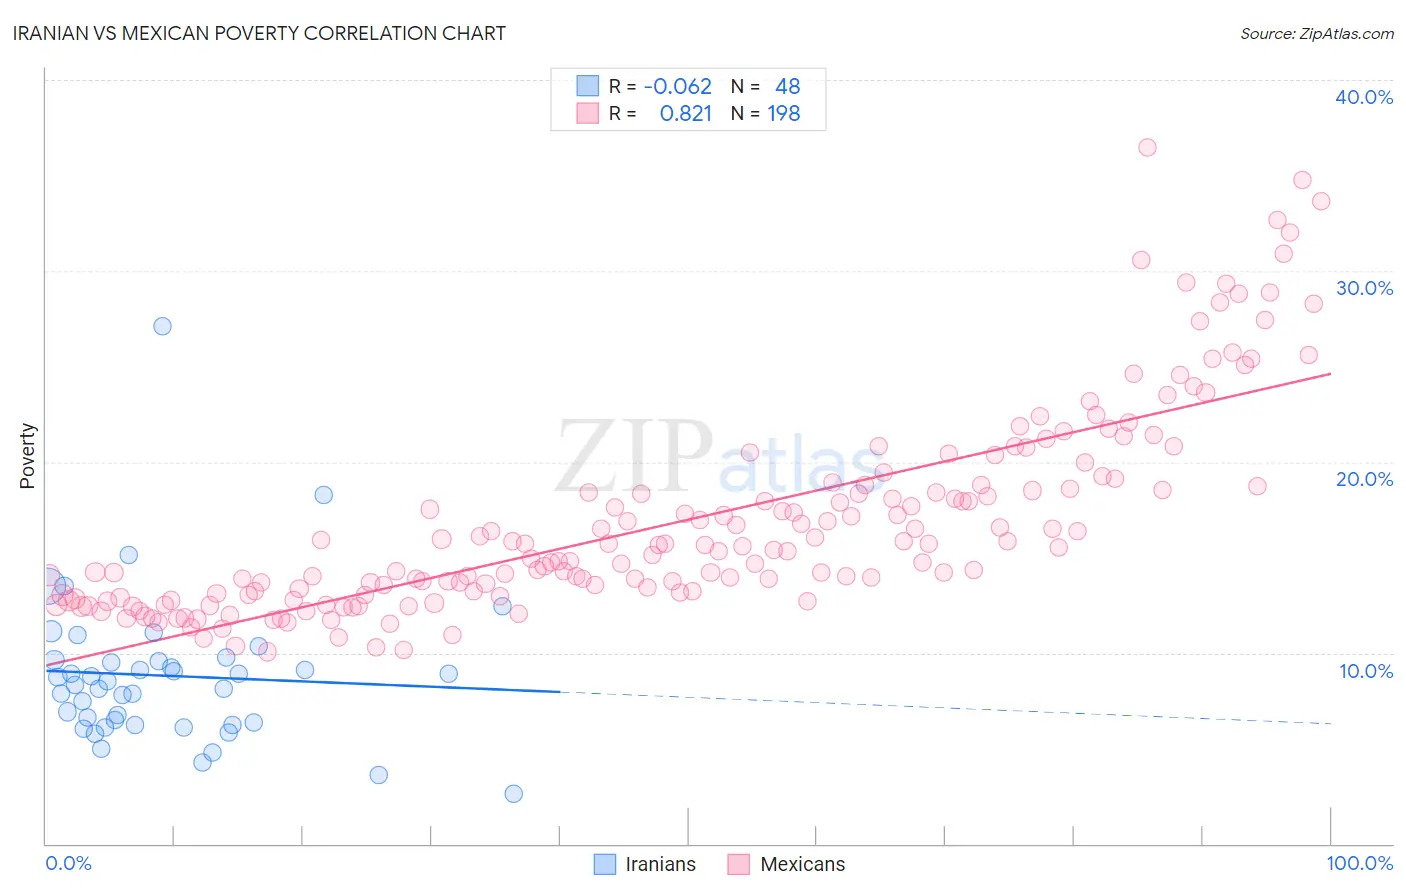
Iranian vs Mexican Poverty Correlation Chart
The statistical analysis conducted on geographies consisting of 316,670,706 people shows a slight negative correlation between the proportion of Iranians and poverty level in the United States with a correlation coefficient (R) of -0.062 and weighted average of 10.7%. Similarly, the statistical analysis conducted on geographies consisting of 564,427,713 people shows a very strong positive correlation between the proportion of Mexicans and poverty level in the United States with a correlation coefficient (R) of 0.821 and weighted average of 15.1%, a difference of 40.6%.
Poverty Correlation Summary
| Measurement | Iranian | Mexican |
| Minimum | 2.6% | 10.1% |
| Maximum | 27.1% | 36.5% |
| Range | 24.5% | 26.4% |
| Mean | 8.8% | 16.9% |
| Median | 8.4% | 15.4% |
| Interquartile 25% (IQ1) | 6.3% | 13.1% |
| Interquartile 75% (IQ3) | 9.6% | 18.7% |
| Interquartile Range (IQR) | 3.3% | 5.6% |
| Standard Deviation (Sample) | 4.0% | 5.3% |
| Standard Deviation (Population) | 3.9% | 5.3% |
Similar Demographics by Poverty
Demographics Similar to Iranians by Poverty
In terms of poverty, the demographic groups most similar to Iranians are Polish (10.7%, a difference of 0.090%), Danish (10.7%, a difference of 0.17%), Greek (10.7%, a difference of 0.18%), Immigrants from Korea (10.7%, a difference of 0.27%), and Immigrants from Northern Europe (10.7%, a difference of 0.34%).
| Demographics | Rating | Rank | Poverty |
| Croatians | 99.6 /100 | #25 | Exceptional 10.6% |
| Burmese | 99.6 /100 | #26 | Exceptional 10.7% |
| Immigrants | Northern Europe | 99.6 /100 | #27 | Exceptional 10.7% |
| Immigrants | Korea | 99.5 /100 | #28 | Exceptional 10.7% |
| Greeks | 99.5 /100 | #29 | Exceptional 10.7% |
| Danes | 99.5 /100 | #30 | Exceptional 10.7% |
| Poles | 99.5 /100 | #31 | Exceptional 10.7% |
| Iranians | 99.5 /100 | #32 | Exceptional 10.7% |
| Macedonians | 99.4 /100 | #33 | Exceptional 10.8% |
| Immigrants | Poland | 99.4 /100 | #34 | Exceptional 10.8% |
| Tongans | 99.4 /100 | #35 | Exceptional 10.8% |
| Cypriots | 99.3 /100 | #36 | Exceptional 10.8% |
| Immigrants | Greece | 99.3 /100 | #37 | Exceptional 10.8% |
| Czechs | 99.3 /100 | #38 | Exceptional 10.8% |
| Immigrants | Pakistan | 99.3 /100 | #39 | Exceptional 10.8% |
Demographics Similar to Mexicans by Poverty
In terms of poverty, the demographic groups most similar to Mexicans are Immigrants from Belize (15.1%, a difference of 0.10%), Immigrants from Cabo Verde (15.1%, a difference of 0.13%), Indonesian (15.1%, a difference of 0.18%), Immigrants from Zaire (15.1%, a difference of 0.18%), and Yaqui (15.1%, a difference of 0.22%).
| Demographics | Rating | Rank | Poverty |
| Immigrants | Haiti | 0.0 /100 | #283 | Tragic 15.0% |
| West Indians | 0.0 /100 | #284 | Tragic 15.0% |
| Vietnamese | 0.0 /100 | #285 | Tragic 15.0% |
| Immigrants | Latin America | 0.0 /100 | #286 | Tragic 15.0% |
| Inupiat | 0.0 /100 | #287 | Tragic 15.1% |
| Yaqui | 0.0 /100 | #288 | Tragic 15.1% |
| Immigrants | Belize | 0.0 /100 | #289 | Tragic 15.1% |
| Mexicans | 0.0 /100 | #290 | Tragic 15.1% |
| Immigrants | Cabo Verde | 0.0 /100 | #291 | Tragic 15.1% |
| Indonesians | 0.0 /100 | #292 | Tragic 15.1% |
| Immigrants | Zaire | 0.0 /100 | #293 | Tragic 15.1% |
| Blackfeet | 0.0 /100 | #294 | Tragic 15.2% |
| Guatemalans | 0.0 /100 | #295 | Tragic 15.3% |
| Hispanics or Latinos | 0.0 /100 | #296 | Tragic 15.3% |
| Immigrants | Bangladesh | 0.0 /100 | #297 | Tragic 15.3% |