Iranian vs Immigrants from Haiti Unemployment Among Women with Children Under 6 years
COMPARE
Iranian
Immigrants from Haiti
Unemployment Among Women with Children Under 6 years
Unemployment Among Women with Children Under 6 years Comparison
Iranians
Immigrants from Haiti
6.7%
UNEMPLOYMENT AMONG WOMEN WITH CHILDREN UNDER 6 YEARS
99.9/ 100
METRIC RATING
44th/ 347
METRIC RANK
8.4%
UNEMPLOYMENT AMONG WOMEN WITH CHILDREN UNDER 6 YEARS
0.2/ 100
METRIC RATING
269th/ 347
METRIC RANK
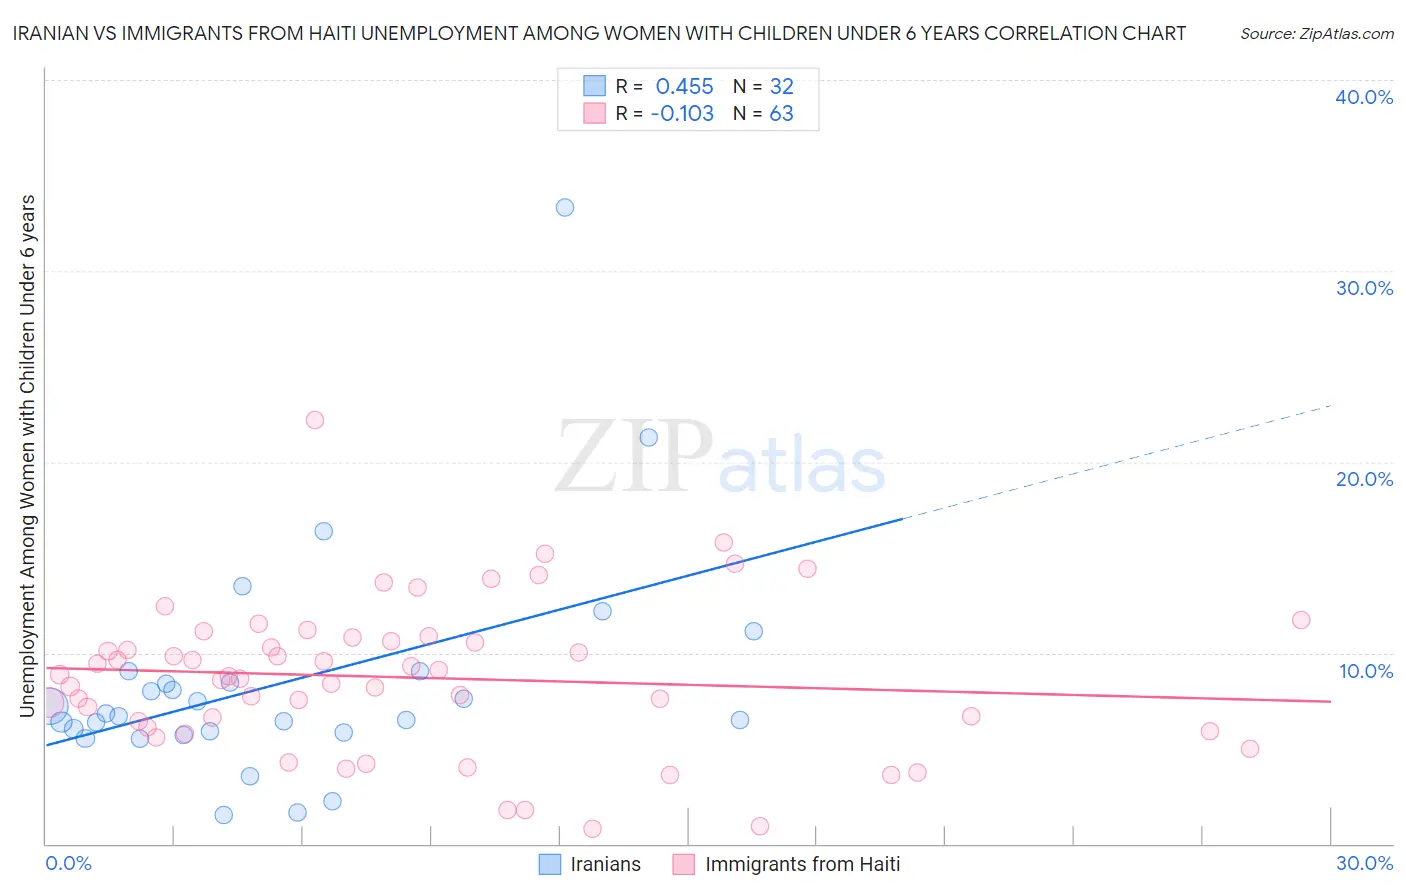
Iranian vs Immigrants from Haiti Unemployment Among Women with Children Under 6 years Correlation Chart
The statistical analysis conducted on geographies consisting of 253,710,938 people shows a moderate positive correlation between the proportion of Iranians and unemployment rate among women with children under the age of 6 in the United States with a correlation coefficient (R) of 0.455 and weighted average of 6.7%. Similarly, the statistical analysis conducted on geographies consisting of 184,706,407 people shows a poor negative correlation between the proportion of Immigrants from Haiti and unemployment rate among women with children under the age of 6 in the United States with a correlation coefficient (R) of -0.103 and weighted average of 8.4%, a difference of 25.0%.
Unemployment Among Women with Children Under 6 years Correlation Summary
| Measurement | Iranian | Immigrants from Haiti |
| Minimum | 1.5% | 0.80% |
| Maximum | 33.3% | 22.2% |
| Range | 31.8% | 21.4% |
| Mean | 8.4% | 8.7% |
| Median | 6.7% | 8.8% |
| Interquartile 25% (IQ1) | 5.8% | 6.1% |
| Interquartile 75% (IQ3) | 8.7% | 10.8% |
| Interquartile Range (IQR) | 2.9% | 4.7% |
| Standard Deviation (Sample) | 6.0% | 4.0% |
| Standard Deviation (Population) | 5.9% | 3.9% |
Similar Demographics by Unemployment Among Women with Children Under 6 years
Demographics Similar to Iranians by Unemployment Among Women with Children Under 6 years
In terms of unemployment among women with children under 6 years, the demographic groups most similar to Iranians are Immigrants from Australia (6.8%, a difference of 0.060%), Latvian (6.8%, a difference of 0.30%), Immigrants from Asia (6.8%, a difference of 0.47%), Immigrants from Switzerland (6.8%, a difference of 0.50%), and Bhutanese (6.7%, a difference of 0.55%).
| Demographics | Rating | Rank | Unemployment Among Women with Children Under 6 years |
| Sri Lankans | 100.0 /100 | #37 | Exceptional 6.6% |
| Hmong | 100.0 /100 | #38 | Exceptional 6.7% |
| Immigrants | Russia | 100.0 /100 | #39 | Exceptional 6.7% |
| Asians | 100.0 /100 | #40 | Exceptional 6.7% |
| Immigrants | Indonesia | 99.9 /100 | #41 | Exceptional 6.7% |
| Immigrants | Cuba | 99.9 /100 | #42 | Exceptional 6.7% |
| Bhutanese | 99.9 /100 | #43 | Exceptional 6.7% |
| Iranians | 99.9 /100 | #44 | Exceptional 6.7% |
| Immigrants | Australia | 99.9 /100 | #45 | Exceptional 6.8% |
| Latvians | 99.9 /100 | #46 | Exceptional 6.8% |
| Immigrants | Asia | 99.9 /100 | #47 | Exceptional 6.8% |
| Immigrants | Switzerland | 99.9 /100 | #48 | Exceptional 6.8% |
| Immigrants | Nepal | 99.9 /100 | #49 | Exceptional 6.8% |
| Immigrants | Ireland | 99.9 /100 | #50 | Exceptional 6.8% |
| Ethiopians | 99.9 /100 | #51 | Exceptional 6.8% |
Demographics Similar to Immigrants from Haiti by Unemployment Among Women with Children Under 6 years
In terms of unemployment among women with children under 6 years, the demographic groups most similar to Immigrants from Haiti are Subsaharan African (8.4%, a difference of 0.090%), Belizean (8.4%, a difference of 0.19%), Immigrants from Senegal (8.5%, a difference of 0.34%), Immigrants from Congo (8.5%, a difference of 0.35%), and Immigrants from Honduras (8.4%, a difference of 0.45%).
| Demographics | Rating | Rank | Unemployment Among Women with Children Under 6 years |
| West Indians | 0.3 /100 | #262 | Tragic 8.4% |
| Scotch-Irish | 0.3 /100 | #263 | Tragic 8.4% |
| Hondurans | 0.3 /100 | #264 | Tragic 8.4% |
| French Canadians | 0.3 /100 | #265 | Tragic 8.4% |
| Immigrants | Honduras | 0.3 /100 | #266 | Tragic 8.4% |
| Belizeans | 0.2 /100 | #267 | Tragic 8.4% |
| Sub-Saharan Africans | 0.2 /100 | #268 | Tragic 8.4% |
| Immigrants | Haiti | 0.2 /100 | #269 | Tragic 8.4% |
| Immigrants | Senegal | 0.2 /100 | #270 | Tragic 8.5% |
| Immigrants | Congo | 0.2 /100 | #271 | Tragic 8.5% |
| Mexican American Indians | 0.1 /100 | #272 | Tragic 8.5% |
| Slovaks | 0.1 /100 | #273 | Tragic 8.5% |
| Immigrants | Cameroon | 0.1 /100 | #274 | Tragic 8.6% |
| Immigrants | Latin America | 0.1 /100 | #275 | Tragic 8.6% |
| Yaqui | 0.0 /100 | #276 | Tragic 8.6% |